
Figure 4. Ionomycin-evoked exocytotic events and cell volume changes in antral mucous cells.
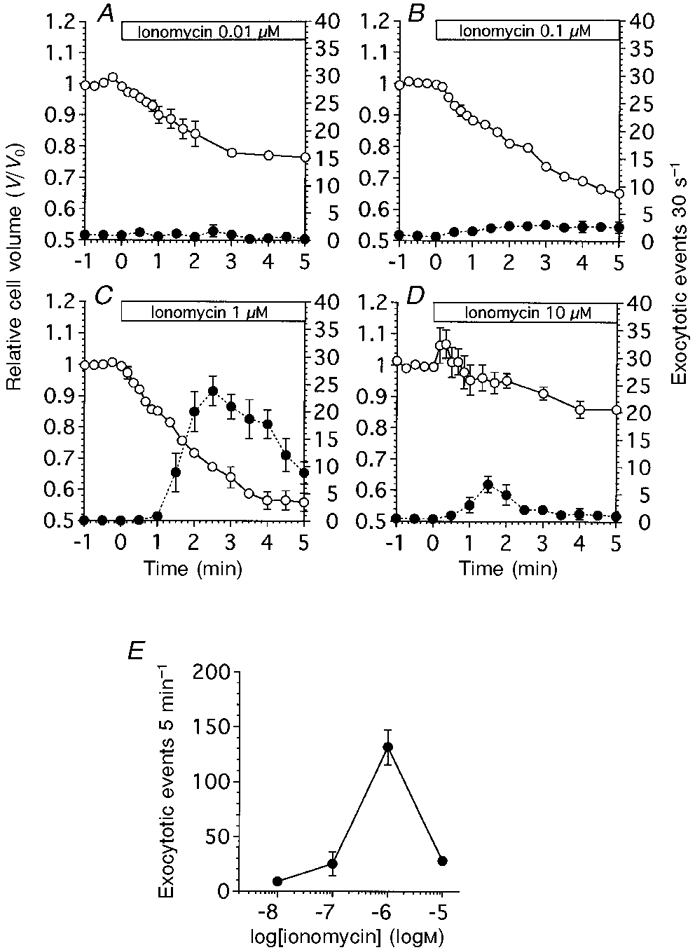
The values of relative cell volume (V/V0) were normalized to the control value. The number of exocytotic events 30 s−1 was counted from the video images and normalized to the cell number (30 s−1 cell−1). V/V0 is denoted by ○, and the frequency of exocytotic events is denoted by •. A, ionomycin at 0.01 μM (n = 4). The frequency of exocytotic events increased slightly and cell shrinkage was observed. B, ionomycin at 0.1 μM (n = 5). The frequency of exocytotic events increased slightly. C, ionomycin at 1 μM (n = 6). The frequency of exocytotic events increased significantly. The cell volume changes consisted of two phases: initial cell shrinkage followed by delayed cell shrinkage. D, ionomycin at 10 μM (n = 4). Both the frequency of exocytotic events and extent of cell shrinkage were suppressed compared with those evoked by 1 μM ionomycin. E, dose-response curve for ionomycin. The frequency of exocytotic events, normalized to the cell number, during ionomycin infusion (5 min−1 cell−1) is plotted against ionomycin concentration. Ionomycin at 10 μM reduced the frequency of exocytotic events.