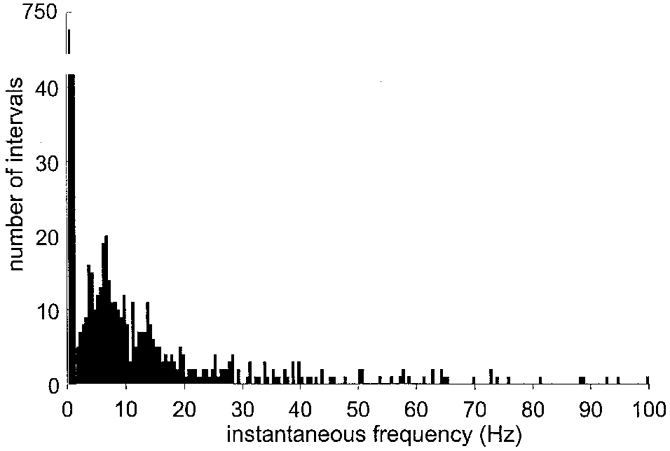
Figure 3. Distribution of firing rates for all muscle vasoconstrictor neurones.

Pooled data from 19 muscle vasoconstrictor neurones. Note break of the y-axis, which indicates that most interspike intervals were long (i.e. that most instantaneous frequencies were low).
