
Figure 9. Incidence of multiple firing at rest and during inspiratory apnoea.
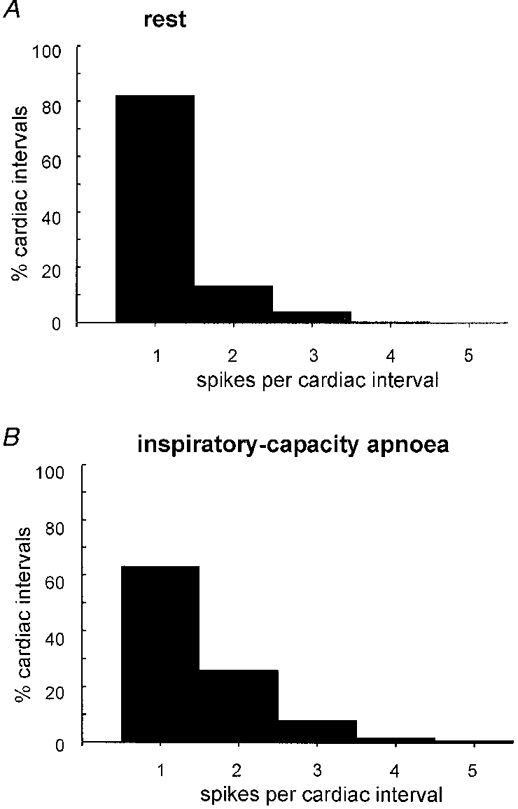
Histograms showing the percentage of cardiac intervals in which a unit generated 1, 2, 3, 4 or 5 spikes at rest (A) or during the static phase of an inspiratory-capacity apnoea (B). Only those cardiac intervals in which the units were active are included; data pooled from 9 units studied in both conditions.