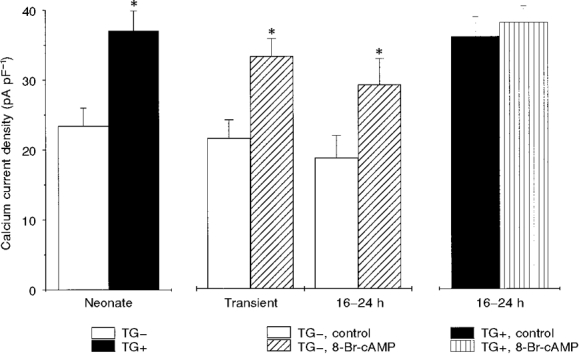
Figure 4. Comparison of the effects of β2-AR overexpression and 8-Br-cAMP (300 μM) on peak ICa.

Bar graphs summarizing peak current densities recorded at +10 mV. Left, peak currents in TG- (n = 26) vs. TG+ (n = 30) cells. Middle, peak current density in TG- cells before and after transient (< 3 min; middle left, n = 6 each) and prolonged (16-24 h; middle right, n = 8 each) exposure to 8-Br-cAMP. * There was no significant difference between the enhancement of peak ICa in the TG+ cells (left) and that produced by 8-Br-cAMP in TG- cells (middle; unpaired t test, P > 0.05). Right, peak current density before and after prolonged exposure of TG+ cells to the same concentration of 8-Br-cAMP.
