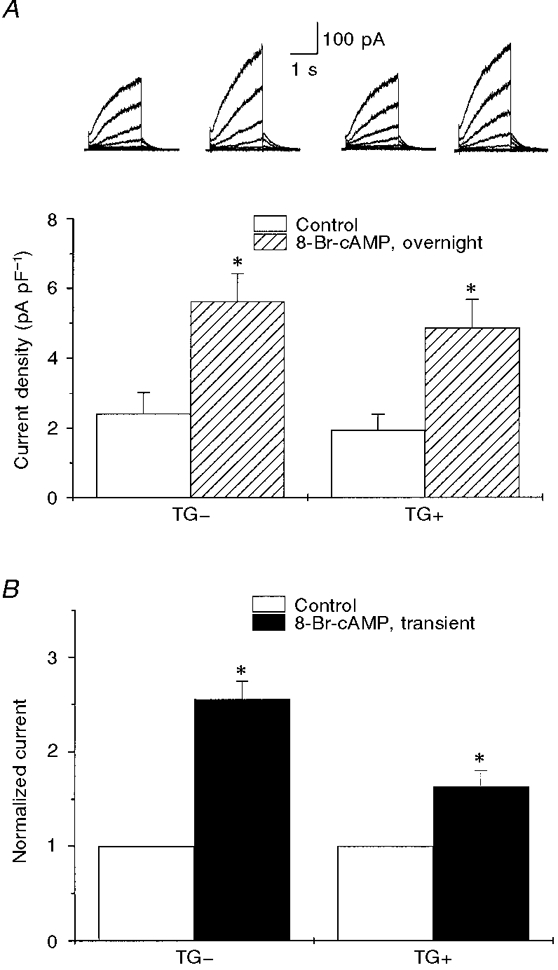
Figure 7. Effects of 8-Br-cAMP on IK,s in TG+ and TG- cells.

A shows mean IK,s density measured at +40 mV in TG- and TG+ cells in the absence of 8-Br-cAMP (Control) and after 16-24 h incubation in the presence of 8-Br-cAMP (300 μM), n = 5-18. Representative IK,s traces (at +60 mV) before and after exposure to cAMP in TG- and TG+ cells are shown above the bars. * Significant difference compared with control, P < 0.01. B shows the relative IK,s amplitude before (Control) and after transient (< 3 min) exposure to 300 μM 8-Br-cAMP in TG- and TG+ cells. Currents were normalized to those in control (n = 2-6). * Significant difference compared with control, P < 0.01.
