
Figure 1. Calibration of NO-sensitive microelectrode.
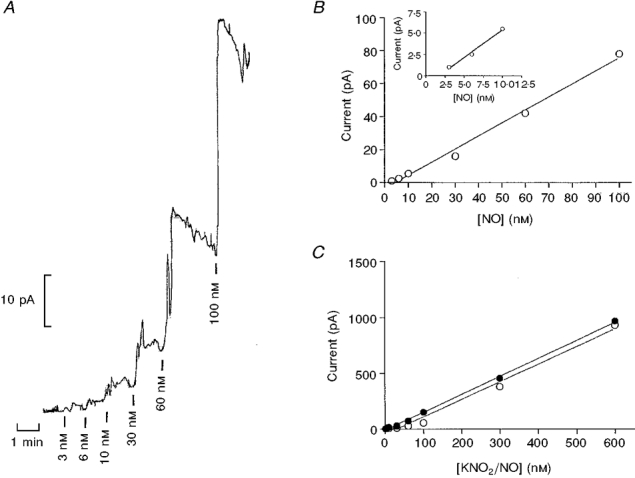
A, representative recording of the NO microelectrode calibration performed in a glass vial containing PSS at 37 °C with constant stirring. The vertical bars below the trace indicate injection of increasing concentrations of NO. The horizontal bar indicates time. B, linear regression analysis of the relationship between amount of NO added and output of the electrode for one electrode tip (ISONOP30), r2 = 0.9928, 1 pA = 3.0 nM. The inset shows the relationship for the lowest concentrations with this electrode. C, linear regression analyses of relationship for authentic NO (○) and chemical titration (•) versus current output for a membrane-type electrode, showing that both calibrations give the same result.