Abstract
Inactivation and recovery kinetics of L-type calcium currents were measured in myotubes derived from satellite cells of human skeletal muscle using the whole cell patch clamp technique.
The time course of inactivation at potentials above the activation threshold was obtained from the decay of the current during 15 s depolarizing pulses. At subthreshold potentials, prepulses of different durations, followed by +20 mV test pulses, were used. The time course could be well described by single exponential functions of time. The time constant decreased from 17.8 ± 7.5 s at -30 mV to 1.78 ± 0.15 s at +50 mV.
Restoration from inactivation caused by 15 s depolarization to +20 mV was slowed by depolarization in the restoration interval. The time constant increased from 1.11 ± 0.17 s at -90 mV to 7.57 ± 2.54 s at -10 mV.
Restoration showed different kinetics depending on the duration of the conditioning depolarization. While the time constant was similar at restoration potentials of -90 and -50 mV after a 1 s conditioning prepulse, it increased with increasing prepulse duration at -50 mV and decreased at -90 mV.
The experiments showed that the rates of inactivation and restoration of the L-type calcium current in human myotubes were not identical when observed at the same potential. The results indicate the presence of more than one inactivated state and point to different voltage-dependent pathways for inactivation and restoration.
Dihydropyridine (DHP) receptors in skeletal muscle sense membrane voltage for the control of calcium release from the sarcoplasmic reticulum (SR) (Rios & Brum, 1987). In addition they permit an extremely slow calcium inward current (L-type current) whose physiological role is still unclear (for a review see Melzer et al. 1995). L-type current characteristics have been extensively studied in adult amphibian and mammalian skeletal muscle (for references see Delbono, 1992; Feldmeyer et al. 1990, 1992, 1995; Garcia et al. 1992; Francini et al. 1996). On the other hand, important data on structure-function relationships of the channel have been obtained by heterologous expression of recombinant DHP receptors in cultured immature muscle cells (myotubes) (Tanabe et al. 1988; Garcia et al. 1994). The functions and their structural determinants studied most thoroughly in this preparation concerned activation kinetics and involvement in excitation-contraction (EC) coupling (e.g. Tanabe et al. 1990, 1991). The molecular basis of inactivation which L-type channels exhibit at maintained depolarization has been investigated using the cardiac isoform of the DHP receptor by expression of recombinant DNA mainly in non-muscle cells. The cardiac L-type channel shows a pronounced Ca2+-dependent inactivation in addition to a slower voltage-dependent decline. Determinants for Ca2+-dependent inactivation have been assigned to the C-terminal region (Babitch, 1990; Imredy & Yue, 1994; de Leon et al. 1995; Zühlke & Reuter, 1998) with possible involvement of the cytoplasmic loops I-II and II-III (Adams & Tanabe, 1997) and for voltage-dependent inactivation to transmembrane segment S6 of repeat I (Zhang et al. 1994). Skeletal muscle L-type channels seem to possess exclusively voltage-dependent inactivation. The structural basis of this mechanism and its physiological role are still unknown. It may be of importance in modulating the efficacy of internal calcium release. The slow voltage-dependent inactivation resembles the slow inactivation (C-type) found in potassium and sodium channels rather than the more rapid chain and ball mechanism (N-type) of these channels (Hoshi et al. 1991; Featherstone et al. 1996; Liu et al. 1996; Kontis & Goldin, 1997). The characteristics of this type of inactivation have not yet been fully determined in any skeletal muscle preparation and particularly little information is available from human preparations which have recently attracted attention due to the discovery of L-type Ca2+ channel-related diseases (Jurkat-Rott et al. 1994; Ptacek et al. 1994; Monnier et al. 1997). A few studies describe voltage-dependent activation and inactivation in human muscle cells (Rivet et al. 1990, 1992; Garcia et al. 1992; Sipos et al. 1995; Lehmann-Horn et al. 1995; Jurkat-Rott et al. 1998) but no data are available on the dynamics of the transition to and the recovery from the inactive state(s). The purpose of the present investigation was to characterize these processes in cultured myocytes. We measured the kinetics of inactivation and its restoration by applying the tight seal whole cell voltage clamp technique to myotubes derived from human skeletal muscle.
METHODS
Cell culture
Human satellite cells enzymatically isolated from muscle tissue waste of orthopaedic surgery were used for our experiments in accordance with the regulations of the local ethics commissions. Myotubes were cultured as previously described (Sipos et al. 1995, 1997). The medium used for proliferation of the cells was a mixture (1:1) of Ham's F-12 and CMRL-1066 (Gibco) with 5 % fetal calf serum (FCS) and 5 % horse serum (HS) (both from Gibco). The cultures were kept in a 5 % CO2 atmosphere. After 1-2 days of division the serum content of the culture medium was reduced to 2 % of FCS and 2 % HS to induce myoblast fusion and differentiation.
Voltage clamp
Experiments were carried out between days 6 and 12 after changing to the differentiation medium. For whole cell patch clamping, an Axopatch 200A amplifier (Axon Instruments) was used. Data acquisition was carried out with a TL1 interface in conjunction with an IBM AT386-compatible microcomputer and pCLAMP 6.0.1 software (Axon Instruments). Suction pipettes were made of borosilicate glass capillaries (GB200-8P or GB150-8P, Science Products, Hofheim, Germany) and had resistances of 1.5-2 MΩ when filled with artificial internal solution. Series resistance and linear capacitive current were partially compensated. The holding potential was -90 mV. Experiments were carried out at room temperature (22-24°C).
Experimental solutions
The composition of the external solution was (mM): 120 TEACl, 10 CaCl2, 1 MgCl2, 10 Hepes, 5 glucose (pH set to 7.4 using TEAOH). The composition of the pipette solution was (mM): 130 CsCl, 0.5 MgCl2, 1 EGTA, 10 Hepes, 5 MgATP, 5 creatine phosphate (pH set to 7.2 using CsOH). All chemical material was obtained from Sigma.
Data analysis
Passive electrical parameters of the cells were determined with 5 mV pulses (100 ms) at the holding potential. The linear capacitance of the cells averaged 184 ± 95 pF. The current records were leak corrected assuming a non-selective linear resistive leak.
Peak current-voltage relations were described by:
| (1) |
where F is a gating variable to describe fractional activation, Gmax is conductance of the fully activated system, V is membrane potential and VCa is reversal potential of the calcium channels.
Fractional activation and inactivation were described by Boltzmann functions:
| (2) |
where V½ is voltage for F = 0.5 and k is the steepness parameter (positive for activation, negative for inactivation).
Theoretical curves were fitted to measured data using a non-linear least squares algorithm (NFIT, University of Texas, Galveston, TX, USA). Data of individual experiments were fitted separately. The best fit parameter values obtained from different experiments were averaged and used for constructing the fit curves in figures containing averaged data. Data are presented as means and standard deviations. Differences between averaged data were evaluated by Student's t test and were considered to be significant if P ≤ 0.05.
RESULTS
Activation and inactivation
To study the voltage dependence of inactivation and its dynamics, we used the experimental protocol shown in Fig. 1A (top trace). Depolarizations lasting 15 s to different potentials between -80 and +30 mV were followed by a short (200 ms) repolarization to the holding potential of -90 mV and a subsequent pulse to +20 mV which tested the remaining availability of channels for activation. Example traces are shown for three different prepulse potentials (-30, 0, and +30 mV). After 15 s of depolarization the decline had generally reached a steady level close to zero. In ca 20 % of the investigated cells, a steady inward current remained at the end of the 15 s prepulse (see for instance Fig. 5A).
Figure 1. Comparison of inactivation and activation.
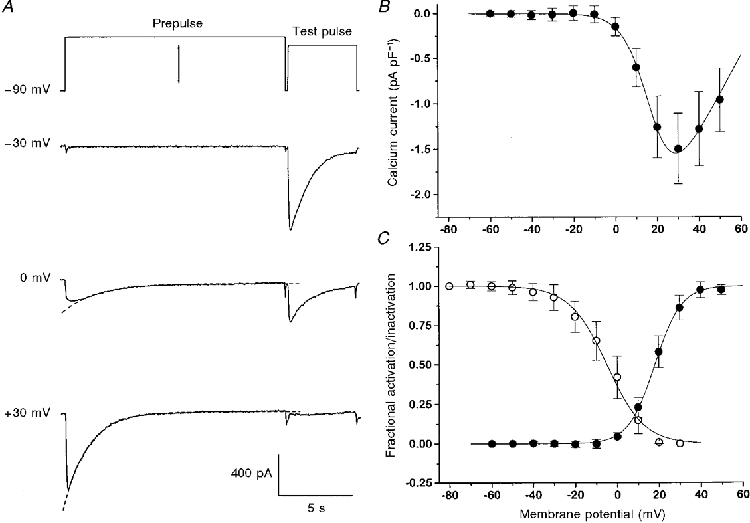
A, prepulses (here -30, 0 and 30 mV) of 15 s duration were used to inactivate the current. The degree of inactivation was determined by applying a second pulse (test pulse) to +20 mV after a 200 ms repolarization interval. The waiting interval to the beginning of the next prepulse was 60 s. B, current- voltage relation constructed from average peak inward currents. C, normalized inward current amplitude at the test pulse plotted as a function of the prepulse potential (○). The values obtained at -80 and +30 mV represent 1 and 0, respectively. Averaged data from 9 experiments like the one shown in A.•, voltage dependence of activation of inward current conductance determined from the peak current-voltage relations of B. Each experimental set of data was fitted individually by the appropriate functions as described in Methods. The continuous Boltzmann activation and inactivation curves were constructed by using the mean values of the parameters V½ and k. For inactivation, the values were V½ = -3.8 ± 5.2 mV and k = -9.7 ± 1.4 mV (un = 9); for activation V½ = 18.1 ± 2.3 mV, k = 6.4 ± 1.5 mV, Gmax = 42.8 ± 7.4 pS pF−1 and VCa = 71.0 ± 8.9 mV (see eqn (1), n = 15).
Figure 5. Restoration from inactivation.
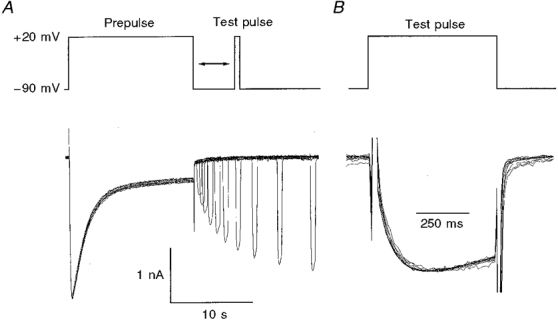
A, inactivation was produced by depolarizing pulses to +20 mV of 15 s duration. The degree of recovery was determined by applying 500 ms test pulses to +20 mV at variable distance from the end of the prepulse. The time between the end of the test pulse and the beginning of the next prepulse was 90 s. The example shows an experiment at a restoration potential of -90 mV. B, superimposed and scaled test pulse responses of the restoration experiment shown in A.
The fractional inactivation obtained after 15 s of depolarization is plotted in Fig. 1A (open symbols) as a function of prepulse voltage. The fitted curve shows a Boltzmann relation calculated by using the parameter values V½ = -3.8 mV and k = -9.7 mV. Figure 1B shows the average peak current-voltage relation obtained from measurements with different depolarizating pulses and the best fit to the data using eqns (1) and (2) (continuous line). The filled circles in Fig. 1A show the averaged voltage dependence of conductance activation at a holding potential of -90 mV obtained from Fig. 1B. The mean Boltzmann parameter values used for constructing the activation curve were V½ = 18.1 mV and k = 6.4 mV. As can be seen, there is relatively little overlap between the activation and inactivation curves, and hence, on average, only a small window current can be expected around +10 mV in the steady state.
Time course of inactivation
The time course of inactivation of the current during the prepulses was quantified by fitting the decline with a single exponential function plus constant (see dashed lines superimposed on the records in Fig. 1A). Those cases which could not be fitted by a single exponential showed indications of an outward current at strong depolarizations and were omitted from the kinetic analysis. The resulting time constants are plotted versus the corresponding membrane potential in Fig. 3 (filled symbols). The time constants varied only slightly in the investigated voltage range, showing values of 1.97 ± 0.09 s at +10 mV and 1.78 ± 0.15 s at +50 mV.
Figure 3. Averaged time constants of inactivation.

•, kinetics derived from single exponential fits to the slow inward current decline as a function of prepulse voltage (n = 6). At 0 mV, currents are normally very small (see Fig. 1B) and therefore inactivation kinetics not well resolvable. The bracketed data point is the mean of two experiments in which a fit could be carried out. □, inactivation kinetics at mostly subthreshold potentials determined by prepulses of increasing duration. The procedure was identical to the one demonstated in Fig. 2A for the potential of +20 mV. Results of 3 (-30 mV), 1 (-20 mV), 6 (-10 mV), 7 (0 mV) and 6 (+20 mV) experiments.
In a second series of experiments, we also determined the time course of inactivation at more negative potentials where the current is not measurable or hardly measurable due to small fractional conductance activation (see Fig. 1A and C). For each potential, the duration of the prepulse was increased (Fig. 2A, top trace) to achieve increasing degrees of inactivation which were subsequently tested with a depolarization to +20 mV, i.e. at a potential where the current amplitude is large according to Fig. 1B.
Figure 2. Inactivation kinetics determined with prepulses of increasing duration.
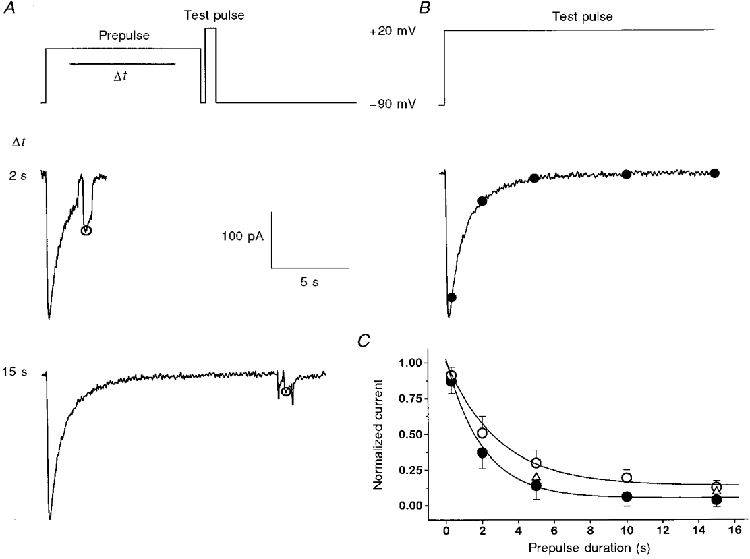
A, top trace, general pulse protocol used. Inactivation was produced by depolarizing prepulses of durations 0.3, 2, 5, 10 and 15 s. The degree of inactivation was checked by applying a 330 ms repolarization and a second (test) depolarization. The two traces show example records for two different prepulses (2 and 15 s) at +20 mV. B and C, the time course of channel inactivation at +20 mV derived from the current decline (•; n = 6) was compared with inactivation determined with the prepulse protocol shown in A (○; n = 6). At two durations (5 and 15 s; ▵), a correction was also made for the degree of repriming within the repolarization interval, assuming single exponential restoration and the time constant of 1.1 s obtained from the experiments shown in Fig. 6.
In Fig. 2 both procedures to determine the time course of inactivation are compared at the potential of +20 mV. Figure 2A shows two measurements with prepulse durations of 2 and 15 s. The current amplitude at the test pulse normalized by the peak current amplitude in the absence of a prepulse is plotted versus prepulse duration in Fig. 2A (open symbols). The values are compared with the corresponding normalized current values (filled circles) of the declining phase during a long pulse to the same potential (+20 mV; Fig. 2A). The two curves differ due to restoration in the repolarization interval. A repolarization interval was applied to provide a baseline for the test current and to minimize possible interference from tail currents and any outward current with slow activation and rapid deactivation. After correction for restoration (using the time course shown in Fig. 6) the values obtained with the double pulse protocol are close to the values determined from the declining phase (open triangles). Even without the correction the difference is relatively small and the inactivation time constants determined with the two methods were similar (the τ values at +20 mV were 2.91 and 2.03 s with and without prepulse protocol, respectively).
Figure 6. Time course of restoration from inactivation.
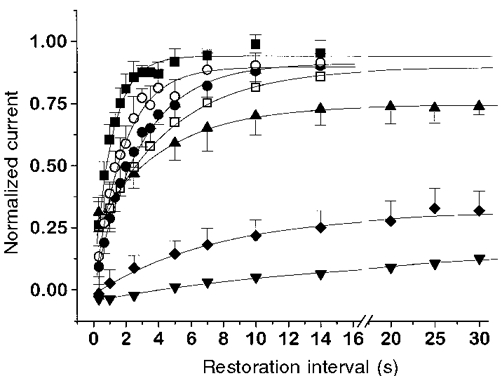
Fractional restoration from a 15 s depolarization to +20 mV determined with the procedure shown in Fig. 5 at 7 different membrane potentials (mV): -90, ▪ (n = 4); -80, ○ (n = 3); -70, • (n = 4); -50, □ (n = 4); -30, ▴ (n = 2); -10, ♦ (n = 5); 0, ▾ (n = 1). The time course of restoration was fitted with single exponential functions plus constant.
The values obtained for the inactivation time constants with the two measurement protocols of Figs 1 and 2 are plotted versus membrane voltage in Fig. 3 (filled circles and open squares, respectively). Between -30 and 0 mV, the time course of inactivation was studied with prepulses of up to 60 s duration. The slow rates determined in this potential range show that 15 s prepulses as used in Fig. 1 are not sufficient to obtain a true steady state. Much longer depolarizations, not feasible for routine applications, would be necessary. For alternative estimates of the steady state values of inactivation we took the final values of the exponential fits used for determining the time constants at subthreshold potentials in Fig. 3. At -30, -10 and 0 mV the values for fractional inactivation obtained in this way were 0.59 ± 0.21, 0.33 ± 0.15 and 0.23 ± 0.18, respectively, compared with 0.93 ± 0.08, 0.80 ± 0.10 and 0.42 ± 0.14, respectively, obtained with the protocol of Fig. 1A.
Despite the relatively large scattering at the lower depolarizations, the plot in Fig. 3 shows that inactivation kinetics are voltage dependent and are considerably sped up at potentials above -10 mV, i.e. above the threshold of calcium conductance activation (see Fig. 1A). We considered the possibility that the time course of inactivation has a calcium influx-dependent component. Therefore, we looked at the time course of the test pulse current records (Fig. 1A) used for determining the fractional inactivation. For the various prepulse potentials, the peak amplitude of the test pulse current density varies considerably in a single experiment (Fig. 1A). Thus, one might expect a more rapid decline for the larger currents if calcium-dependent inactivation (and cross-talk between channels) were present.
Figure 4 shows that this was not the case. Figure 4A displays superimposed test current records for prepulse potentials between -80 and +10 mV. The sequence covers a 5-fold range of current amplitudes scaled to the same peak and shows negligible differences in the time course. The rate of decline was determined for each record by fitting a line from 50 to 200 ms after the peak. The data in Fig. 4A show the dependence of this rate on the relative peak current amplitude. No systematic current dependence of inactivation could be seen.
Figure 4. No current dependence of inactivation kinetics.
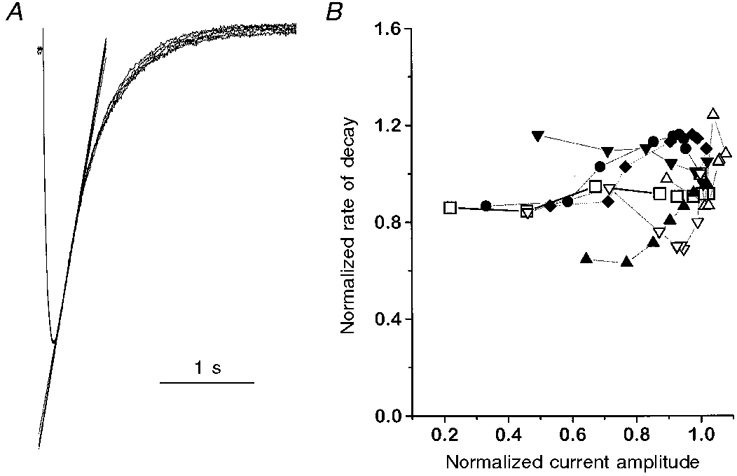
A, test pulse responses for prepulses (not shown) of different amplitude as in Fig. 1. The currents are scaled to the same amplitude and the rate of decay was determined by fitting straight lines in the time interval between 50 and 200 ms after the peak. B, the decay rate (normalized to the value obtained at the control without prepulse) as a function of the normalized current amplitudes (n = 7). Data from the cell in A are indicated by open squares.
Time course of restoration
In further experiments we studied the recovery from inactivation (repriming). To determine the time course of repriming, a test pulse (+20 mV, 500 ms) was applied at different times after termination of a 15 s predepolarization to +20 mV. Figure 5A shows a sequence of 10 measurements with pulse intervals ranging from 300 ms to 14 s. The waiting interval between the short test pulse and the next long prepulse was 90 s. Figure 5B shows the current response at each of the 10 test pulses superimposed and scaled to the same peak. Like Fig. 4, it demonstrates that partial inactivation reduces the amplitude but does not change the shape of the current activated by the test pulse. Inactivation mechanisms which interfere with the time course of gating can therefore be ruled out.
Further experiments were carried out in order to determine how the speed of recovery from inactivation depends on membrane voltage. The voltage dependence of restoration was studied by varying the membrane potential in the interval between prepulse and test pulse.
The results of these experiments are summarized in Fig. 6. The amplitudes of the currents activated by the test pulses were normalized by the prepulse current and are plotted versus restoration time. For potentials between -90 and -50 mV, restoration was followed for up to 14 s at which time more than 80 % of the signal had recovered. Recovery was considerably delayed at less negative potentials. At potentials between -30 and 0 mV, restoration was slower and remained incomplete even though longer intervals (up to 30 s) were used.
The time course of restoration could be well fitted (continuous lines in Fig. 6) by single exponentials of the form:
| (3) |
Using two exponentials did not improve the fit. The averaged time constants obtained at each restoration membrane potential are plotted in Fig. 7A. While recovery at -90 mV occurred with a time constant of 1.11 ± 0.17 s, the estimated time constant at -10 mV is about 7 times larger (7.57 ± 2.54 s). One measurement could be done at 0 mV, the threshold of current activation. It showed an even larger time constant (15.8 s). Thus, L-type current repriming is strongly affected by membrane voltage.
Figure 7. Time constants and final values of restoration at different membrane potentials.
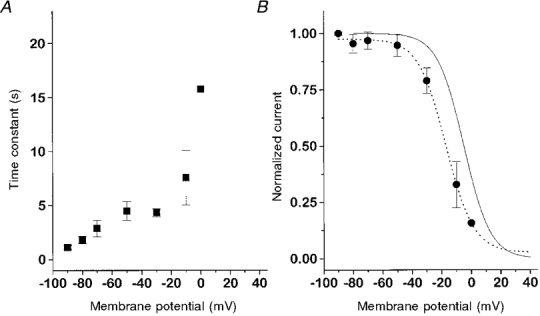
A, average restoration time constants of the experiments in Fig. 6 plotted versus the membrane potential in the restoration interval. B, comparison of voltage dependence of steady state restoration (Aend - values obtained from the fits in Fig. 6, •; dotted line, Boltzmann fit) and inactivation (see Fig. 1C) corrected for recovery in the pulse interval (continuous line).
In Fig. 7A, the end values (Aend) from the fit (eqn (3)) are plotted versus membrane potential (filled circles). The dotted line shows a Boltzmann fit to the data which yielded half-maximal restoration at -17 mV and a slope factor of -9.2 mV. These quasi-steady state restoration data are compared with the average inactivation curve of Fig. 1A (continuous line), which was corrected for restoration in the 200 ms repolarization interval. It can be seen that the two curves are relatively close to each other but do not superimpose. The difference is likely to have resulted from the fact that a 15 s pulse is not sufficient for steady state inactivation due to the slow kinetics at the subthreshold potentials. In addition, a very slow second phase of restoration which contributes little to the time course within the observation time (14 to 30 s) shown in Fig. 6 cannot be ruled out.
Fast and slow steps of inactivation have been identified in voltage-dependent potassium and sodium channels (for references see Hoshi et al. 1991; Featherstone et al. 1996; Kiss & Korn, 1998). Different stages of inactivation have also been described for the L-type channel in vascular smooth muscle by Nilius et al. (1994); these authors showed that progressive inactivation led to a slowing of restoration. To see if the degree of inactivation has an influence on the time course of recovery, we interrupted inactivation at different times of depolarization and measured the temporal development of recovery in the same way as before. Figure 8 shows examples demonstrating this procedure. Figure 8A is from an experiment in which 1 s prepulses were applied. Each was followed at different times by a 500 ms test pulse. In Fig. 8A, 5 s prepulses were used causing considerably stronger inactivation.
Figure 8. Time course of restoration after prepulses of different duration.
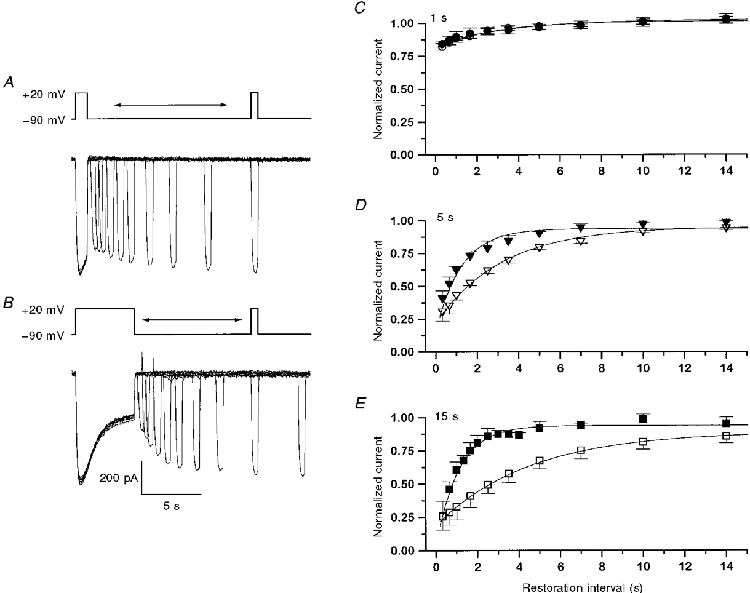
A and B, depolarizing prepulses to +20 mV leading to partial inactivation (duration, 1 s in A and 5 s in B) were followed by restoration intervals of variable length and a fixed test pulse of 500 ms duration to +20 mV. C-E, determination of the recovery time course (average results of 3 to 5 experiments). Depolarizing prepulses to +20 mV of 1 s (C), 5 s (D) and 15 s (E) were applied and the fractional restoration was determined as shown in A and B. In each case two different restoration membrane potentials (-90 mV, filled symbols; -50 mV, open symbols) were used. Continuous lines are fits to the data points by single exponential functions plus constant.
The results obtained with this type of protocol are shown in Fig. 8C-E. Each panel represents a different prepulse length and therefore different degrees of inactivation. In Fig. 8A, a prepulse only 1 s long was applied which led to about 20 % inactivation. In Fig. 8A and E, 5 and 15 s prepulses were applied, respectively, which caused more complete inactivation. The filled symbols represent restoration at -90 mV while the open symbols show the time course of restoration at -50 mV. It can be seen that the restoration speed at the two potentials was similar after the shortest prepulse while it became different after the longer inactivating pulses. The time constants of restoration obtained from the single exponential fits (continuous lines) for the 1, 5 and 15 s prepulses are, respectively, 3.60 ± 1.55 s, 1.24 ± 0.31 s and 1.11 ± 0.17 s at -90 mV and 2.68 ± 0.93 s, 3.18 ± 0.74 s and 4.49 ± 0.88 s at -50 mV. Thus restoration speed does in fact change with the length of the inactivating prepulse, which may be considered as evidence that different sets of inactivated states are occupied after short inactivation than after longer, more complete inactivation.
DISCUSSION
The goal of this study was to quantify the time course and its voltage dependence of inactivation and restoration of the L-type calcium channel in cultured human myocytes. The kinetics of inactivation could be described by monoexponential functions with a voltage-dependent time constant which was less than 2 s at voltages above +10 mV but considerably larger in the voltage range between -30 and 0 mV. The increase in the rate of inactivation was correlated with the activation of the L-type current. Heart and smooth muscle cells exhibit a calcium current-dependent component of inactivation caused by the rise of calcium concentration at the cytoplasmic side of the channel (for references see McDonald et al. 1994). In contrast to the cardiac L-type channel, Ca2+ current passed by the heterologously expressed skeletal muscle isoform did not show a U-shaped dependence of the inactivation time constant on voltage (Gonzalez et al. 1995). In addition, substituting Ba2+ for Ca2+ caused relatively minor kinetic changes of the current in primary cultured skeletal myocytes, although the contribution of a Ca2+-dependent component to the slow decline could not be ruled out (Cognard et al. 1986; Beam & Knudson, 1988; Rivet et al. 1990). In frog skeletal muscle fibres, Almers et al. (1981) identified a decline of the current which was correlated with its size even under conditions of very strong internal calcium buffering. It was attributed to Ca2+ depletion of the T-tubules. Since T-tubular DHP receptors have been demonstrated in myotubes (Romey et al. 1989; Flucher et al. 1994) one might expect a similar effect in this preparation. In a detailed study of frog fibres, Francini et al. (1992) found a minimum of the time constant of inactivation which roughly coincided with the inward current maximum pointing to a link between current activation and inactivation. For various reasons the authors excluded a current-mediated process. Instead, they explained their observation with a gating scheme containing merely voltage-dependent rate constants. Here, we found no voltage exhibiting a local minimum of the inactivation time constant as reported by Francini et al. (1992) and neither the degree nor the rate of inactivation depended on the current amplitude (see Figs 1 and 4) consistent with the absence of calcium-dependent inactivation or depletion effects.
The time course of both inactivation and restoration could be fitted by single exponential functions. The simplest mechanism to assume would therefore be a first order transition between the resting state and the inactivated state that mediates both inactivation and repriming. However, at those potentials at which both inactivation and restoration could be observed the rates were different. Between -30 and -10 mV, inactivation by subthreshold prepulses was consistently slower than restoration after a strongly activating and inactivating prepulse. Apparently, the process is more complex than a first order reaction and different pathways seem to be taken during inactivation and restoration. It is premature to suggest a particular inactivation scheme but regarding the different voltage dependence of inactivation and restoration kinetics a cyclic gating model should be more appropriate to describe the data than a sequential scheme. Likewise, a cyclic four-state minimum scheme, which was originally proposed for slow inactivation in Na+ channels (Bezanilla et al. 1982) has been shown to explain qualitatively inactivation of gating currents attributed to the DHP receptor in frog muscle (Brum & Rios, 1987) and was also applied to gating charge inactivation of the L-type current in cardiac cells (Shirokov et al. 1992). A cyclic scheme including six states has been suggested by Francini et al. (1992) to explain their observations on Ca2+ current inactivation in frog skeletal muscle.
Clearly distinct fast and slow phases of restoration from conditioning inactivation have been found by Nilius et al. (1994) in experiments on vascular smooth muscle. The time course depended on the duration of the conditioning pulse. After short pulses, recovery was fast and voltage dependent while longer prepulses causing a higher degree of inactivation led to a predominantly slow restoration which lacked voltage dependence. The authors suggest that Ca2+ channels enter a different inactivated state during maintained depolarization from which they can exit only slowly. In our experiments we also noticed changes in restoration kinetics with increasing prepulse duration, but the characteristics were different. At -50 mV restoration got progressively slower, yet kinetically different phases as reported by Nilius et al. (1994) could not be distinguished. At -90 mV restoration showed the opposite behaviour, i.e. the restoration rate was higher after longer pulses (5 and 15 s) than after a short pulse (1 s). We consider this as additional evidence for more than one inactivated state. After short conditioning depolarization, channels occupying a first inactivated state may return to the resting state via a path that is rate limited by a voltage-independent step. For instance, recovery may proceed via a preactivated closed state and the relative voltage independence of this recovery may be related to the weak voltage dependence of activation kinetics (Sipos et al. 1997). After longer depolarization leading to more complete inactivation, a different path of return to the resting state may be taken, now governed by a voltage-dependent rate-limiting step.
The physical basis underlying slow inactivation in skeletal muscle L-type channels can at this time only be speculated upon. Considering data from the homologous cardiac isoform of the L-type channel, a candidate region of importance for the process is intramembranous segment S6 of domain I of the α1 subunit and its adjacent extramembranous loops (Zhang et al. 1994). Because of the reported effects of Ca2+ antagonists favouring inactivation (Bean, 1984; Pizarro et al. 1988; Neuhaus et al. 1990) interaction sites of these drugs with the channel might also participate in the process (for review see Striessnig et al. 1998). Moreover, characteristics of inactivation have been reported to be influenced by additional subunits coexpressed with α1 in non-muscle cells. β subunits accelerate current inactivation (e.g. Singer et al. 1991), the α2δ subunit speeds inactivation of DHP receptor-linked charge movements and slows their repriming (Shirokov et al. 1998) and the γ subunit shifts the voltage dependence of inactivation to more negative potentials (e.g. Singer et al. 1991). The question of whether these effects are also present in the skeletal muscle L-type channel and, if so, which of them determine the behaviour described here, i.e. of the channel in its native environment, remains to be solved.
Note added in proof
After this paper was accepted for publication, a study by J. A. Morrill, R. H. Brown & S. C. Cannon (Journal of Neuroscience18, 10320-10334 (1998)) has appeared that also includes measurements of the kinetics of L-type current inactivation and restoration in human myotubes.
Acknowledgments
We thank Drs F. Lehmann-Horn and H. Brinkmeier for advice and stimulating discussions; we are grateful to B. Dietze for suggestions on the manuscript and to Dr J. Cseri, M. Rudolf, S. Schäfer and A. Varga for excellent help in culturing myotubes. This work was supported by Hungarian Research Grants OTKA T-0616957 and ETT095/1996 to L. K., the BMBF (WTZ-X234.21), OMFB (German-Hungarian Project No. 105) and the European Union (ERBCIPACT 93-1642 to W. M., ERB3510PL922161 to I. S., and CIPA-CT 93.0002).
References
- Adams B, Tanabe T. Structural regions of the cardiac Ca channel α1C subunit involved in Ca-dependent inactivation. Journal of General Physiology. 1997;110:379–389. doi: 10.1085/jgp.110.4.379. 10.1085/jgp.110.4.379. [DOI] [PMC free article] [PubMed] [Google Scholar]
- Almers W, Fink R, Palade PT. Calcium depletion in frog muscle tubules: the decline of calcium current under maintained depolarization. The Journal of Physiology. 1981;312:177–207. doi: 10.1113/jphysiol.1981.sp013623. [DOI] [PMC free article] [PubMed] [Google Scholar]
- Babitch J. Channel hands. Nature. 1990;346:321–322. doi: 10.1038/346321b0. [DOI] [PubMed] [Google Scholar]
- Beam KG, Knudson CM. Calcium currents in embryonic and neonatal mammalian skeletal muscle. Journal of General Physiology. 1988;91:781–798. doi: 10.1085/jgp.91.6.781. [DOI] [PMC free article] [PubMed] [Google Scholar]
- Bean BP. Nitrendipine block of cardiac calcium channels: high-affinity binding to the inactivated state. Proceedings of the National Academy of Sciences of the USA. 1984;81:6388–6392. doi: 10.1073/pnas.81.20.6388. [DOI] [PMC free article] [PubMed] [Google Scholar]
- Bezanilla F, Taylor RE, Fernandez J. Distribution and kinetics of membrane dielectric polarization. I. Long-term inactivation of gating currents. Journal of General Physiology. 1982;79:21–40. doi: 10.1085/jgp.79.1.21. [DOI] [PMC free article] [PubMed] [Google Scholar]
- Brum G, Rios E. Intramembrane charge movement in frog skeletal fibres. Properties of charge 2. The Journal of Physiology. 1987;387:475–505. doi: 10.1113/jphysiol.1987.sp016586. [DOI] [PMC free article] [PubMed] [Google Scholar]
- Cognard C, Romey G, Galizzi J-P, Fosset M, Lazdunski M. Dihydropyridine-sensitive Ca2+ channels in mammalian skeletal muscle cells in culture: Electrophysiological properties and interactions with Ca2+ channel activator (Bay K8644) and inhibitor (PN 200–110) Proceedings of the National Academy of Sciences of the USA. 1986;83:1518–1522. doi: 10.1073/pnas.83.5.1518. [DOI] [PMC free article] [PubMed] [Google Scholar]
- Delbono O. Calcium current activation and charge movement in denervated mammalian skeletal muscle fibres. The Journal of Physiology. 1992;451:187–203. doi: 10.1113/jphysiol.1992.sp019160. [DOI] [PMC free article] [PubMed] [Google Scholar]
- de Leon M, Wang Y, Jones L, Perez-Reyes E, Wei X, Soong TW, Snutch TP, Yue DT. Essential Ca2+-binding motif for Ca2+-sensitive inactivation of L-type Ca2+ channels. Science. 1995;270:1502–1506. doi: 10.1126/science.270.5241.1502. [DOI] [PubMed] [Google Scholar]
- Featherstone D, Richmond JE, Ruben PC. Interaction between fast and slow inactivation in Skm1 sodium channels. Biophysical Journal. 1996;71:3098–3109. doi: 10.1016/S0006-3495(96)79504-8. [DOI] [PMC free article] [PubMed] [Google Scholar]
- Feldmeyer D, Melzer W, Pohl B, Zöllner P. Fast gating kinetics of the slow Ca2+ current in cut skeletal muscle fibres of the frog. The Journal of Physiology. 1990;425:347–367. doi: 10.1113/jphysiol.1990.sp018107. [DOI] [PMC free article] [PubMed] [Google Scholar]
- Feldmeyer D, Melzer W, Pohl B, Zöllner P. Modulation of calcium current gating in frog skeletal muscle by conditioning depolarization. The Journal of Physiology. 1992;457:639–653. doi: 10.1113/jphysiol.1992.sp019399. [DOI] [PMC free article] [PubMed] [Google Scholar]
- Feldmeyer D, Zöllner P, Pohl B, Melzer W. Calcium current reactivation after flash photolysis of nifedipine in skeletal muscle fibres of the frog. The Journal of Physiology. 1995;487:51–56. doi: 10.1113/jphysiol.1995.sp020860. [DOI] [PMC free article] [PubMed] [Google Scholar]
- Flucher BE, Andrews SB, Daniels MP. Molecular organization of transverse tubule/sarcoplasmic reticulum junctions during development of excitation-contraction coupling in skeletal muscle. Molecular Biology of the Cell. 1994;5:1105–1118. doi: 10.1091/mbc.5.10.1105. [DOI] [PMC free article] [PubMed] [Google Scholar]
- Francini F, Bencini C, Squecco R. Activation of L-type calcium channel in twitch skeletal muscle fibres of the frog. The Journal of Physiology. 1996;494:121–140. doi: 10.1113/jphysiol.1996.sp021480. [DOI] [PMC free article] [PubMed] [Google Scholar]
- Francini F, Pizza L, Traina G. Inactivation of the slow calcium current in twitch skeletal muscle fibres of the frog. The Journal of Physiology. 1992;448:633–653. doi: 10.1113/jphysiol.1992.sp019062. [DOI] [PMC free article] [PubMed] [Google Scholar]
- Garcia J, McKinley K, Appel SH, Stefani E. Ca2+ current and charge movement in adult single human skeletal muscle fibres. The Journal of Physiology. 1992;454:183–196. doi: 10.1113/jphysiol.1992.sp019259. [DOI] [PMC free article] [PubMed] [Google Scholar]
- Garcia J, Tanabe T, Beam KG. Relationship of calcium transients to calcium currents and charge movements in myotubes expressing skeletal and cardiac dihydropyridine receptors. Journal of General Physiology. 1994;103:125–147. doi: 10.1085/jgp.103.1.125. 10.1085/jgp.103.1.125. [DOI] [PMC free article] [PubMed] [Google Scholar]
- Gonzalez A, Nakai J, Beam K. Localization of a region in the cardiac L-type calcium channel important for divalent-dependent inactivation. Biophysical Journal. 1995;68:A258. [Google Scholar]
- Hoshi T, Zagotta WN, Aldrich RW. Two types of inactivation in Shaker K+ channels: effects of alterations in the carboxyterminal region. Neuron. 1991;7:547–556. doi: 10.1016/0896-6273(91)90367-9. 10.1016/0896-6273(91)90367-9. [DOI] [PubMed] [Google Scholar]
- Imredy JP, Yue DT. Mechanism of Ca2+-sensitive inactivation of L-type Ca2+ channels. Neuron. 1994;12:1301–1318. doi: 10.1016/0896-6273(94)90446-4. 10.1016/0896-6273(94)90446-4. [DOI] [PubMed] [Google Scholar]
- Jurkat-Rott K, Lehmann-Horn F, Elbaz A, Heine R, Gregg RG, Hogan K, Powers P, Lapie P, Vale-Santos JM, Weissenbach J, Fontaine B. A calcium channel mutation causing hypokalemic periodic paralysis. Human Molecular Genetics. 1994;3:1415–1419. doi: 10.1093/hmg/3.8.1415. [DOI] [PubMed] [Google Scholar]
- Jurkat-Rott K, Uetz U, Pika-Hartlaub U, Powell J, Fontaine B, Melzer W, Lehmann-Horn F. Calcium currents and transients of native and heterologously expressed mutant skeletal muscle DHP receptor α1 subunits (R528H) FEBS Letters. 1998;423:198–204. doi: 10.1016/s0014-5793(98)00090-8. 10.1016/S0014-5793(98)00090-8. [DOI] [PubMed] [Google Scholar]
- Kiss L, Korn SJ. Modulation of C-type inactivation by K+ at the potassium channel selectivity filter. Biophysical Journal. 1998;74:1840–1849. doi: 10.1016/S0006-3495(98)77894-4. [DOI] [PMC free article] [PubMed] [Google Scholar]
- Kontis KJ, Goldin AL. Sodium channel inactivation is altered by substitution of voltage sensor positive charges. Journal of General Physiology. 1997;110:403–413. doi: 10.1085/jgp.110.4.403. 10.1085/jgp.110.4.403. [DOI] [PMC free article] [PubMed] [Google Scholar]
- Lehmann-Horn F, Sipos I, Jurkat-Rott K, Heine R, Brinkmeier H, Fontaine B, Kovacs L, Melzer W. Altered calcium current in human hypokalemic periodic paralysis myotubes expressing mutant L-type calcium channels. In: Dawson CD, Frizzell RA, editors. Ion Channels and Genetic Diseases. New York: Rockefeller University Press; 1995. pp. 101–113. [PubMed] [Google Scholar]
- Liu Y, Jurman ME, Yellen G. Dynamic rearrangement of the outer mouth of a K+ channel during gating. Neuron. 1996;16:859–867. doi: 10.1016/s0896-6273(00)80106-3. 10.1016/S0896-6273(00)80106-3. [DOI] [PubMed] [Google Scholar]
- McDonald TF, Pelzer S, Trautwein W, Pelzer DJ. Regulation and modulation of calcium channels in cardiac, skeletal, and smooth muscle cells. Physiological Reviews. 1994;74:365–507. doi: 10.1152/physrev.1994.74.2.365. [DOI] [PubMed] [Google Scholar]
- Melzer W, Herrmann-Frank A, Lüttgau HCh. The role of Ca2+ ions in excitation-contraction coupling of skeletal muscle fibres. Biochimica et Biophysica Acta. 1995;1241:59–116. doi: 10.1016/0304-4157(94)00014-5. [DOI] [PubMed] [Google Scholar]
- Monnier N, Procaccio V, Stieglitz P, Lunardi J. Malignant-hyperthermia susceptibility is associated with a mutation of the α1-subunit of the human dihydropyridine-sensitive L-type voltage-dependent calcium channel receptor in skeletal muscle. American Journal of Human Genetics. 1997;60:1316–1325. doi: 10.1086/515454. [DOI] [PMC free article] [PubMed] [Google Scholar]
- Neuhaus R, Rosenthal R, Lüttgau HCh. The effects of dihydropyridine derivatives on force and Ca2+ current in frog skeletal muscle fibres. The Journal of Physiology. 1990;427:187–209. doi: 10.1113/jphysiol.1990.sp018167. [DOI] [PMC free article] [PubMed] [Google Scholar]
- Nilius B, Kitamura K, Kuriyama H. Properties of inactivation of calcium channel currents in smooth muscle cells of rabbit portal vein. Pflügers Archiv. 1994;426:239–246. doi: 10.1007/BF00374777. [DOI] [PubMed] [Google Scholar]
- Pizarro G, Brum G, Fill M, Fitts R, Rodriguez M, Uribe I, Rios E. The voltage sensor of skeletal muscle excitation-contraction coupling: A comparison with Ca2+ channels. In: Morad M, Nayler W, Kazda S, Schramm M, editors. The Ca2+ Channel: Structure, Function and Implications. Berlin: Springer-Verlag; 1988. pp. 138–156. [Google Scholar]
- Ptacek LJ, Tawil R, Griggs RC, Engel AG, Layzer RB, Kwiecinski H, McManis PG, Santiago L, Moore M, Fouad G, Bradley P, Leppert MF. Dihydropyridine receptor mutations cause hypokalemic periodic paralysis. Cell. 1994;77:863–868. doi: 10.1016/0092-8674(94)90135-x. [DOI] [PubMed] [Google Scholar]
- Rios E, Brum G. Involvement of dihydropyridine receptors in excitation-contraction coupling in skeletal muscle. Nature. 1987;325:717–720. doi: 10.1038/325717a0. [DOI] [PubMed] [Google Scholar]
- Rivet M, Cognard C, Imbert N, Rideau Y, Duport G, Raymond G. A third type of calcium current in cultured human skeletal muscle cells. Neuroscience Letters. 1992;138:97–102. doi: 10.1016/0304-3940(92)90481-l. [DOI] [PubMed] [Google Scholar]
- Rivet M, Cognard C, Rideau Y, Duport G, Raymond G. Calcium currents in normal and dystrophic human skeletal muscle cells in culture. Cell Calcium. 1990;11:507–514. doi: 10.1016/0143-4160(90)90026-q. [DOI] [PubMed] [Google Scholar]
- Romey G, Garcia L, Dimtriadou V, Pincon-Raymond M, Rieger F, Lazdunski M. Ontogenesis and localization of Ca2+ channels in mammalian skeletal muscle in culture and role in excitation-contraction coupling. Proceedings of the National Academy of Sciences of the USA. 1989;86:2933–2937. doi: 10.1073/pnas.86.8.2933. [DOI] [PMC free article] [PubMed] [Google Scholar]
- Shirokov R, Ferreira G, Yi J, Rios E. Inactivation of gating currents of L-type calcium channels. Specific role of the α2δ subunit. Journal of General Physiology. 1998;111:807–823. doi: 10.1085/jgp.111.6.807. [DOI] [PMC free article] [PubMed] [Google Scholar]
- Shirokov R, Levis R, Shirokova N, Rios E. Two classes of gating current from L-type Ca2+ channels in guinea pig ventricular myocytes. Journal of General Physiology. 1992;99:863–895. doi: 10.1085/jgp.99.6.863. [DOI] [PMC free article] [PubMed] [Google Scholar]
- Singer D, Biel M, Lotan I, Flockerzi V, Hofmann F, Dascal N. The roles of the subunits in the function of the calcium channel. Science. 1991;253:1553–1557. doi: 10.1126/science.1716787. [DOI] [PubMed] [Google Scholar]
- Sipos I, Harasztosi Cs, Melzer W. L-type calcium current activation in cultured human myotubes. Journal of Muscle Research and Cell Motility. 1997;18:353–367. doi: 10.1023/a:1018678227138. [DOI] [PubMed] [Google Scholar]
- Sipos I, Jurkat-Rott K, Harasztosi Cs, Fontaine B, Kovacs L, Melzer W, Lehmann-Horn F. Skeletal muscle DHP receptor mutations alter calcium currents in human hypokalaemic periodic paralysis myotubes. The Journal of Physiology. 1995;483:299–306. doi: 10.1113/jphysiol.1995.sp020586. [DOI] [PMC free article] [PubMed] [Google Scholar]
- Striessnig J, Grabner M, Mitterdorfer J, Hering S, Sinnegger MJ, Glossmann H. Structural basis of drug binding to L Ca2+ channels. Trends in Pharmacological Sciences. 1998;19:108–115. doi: 10.1016/s0165-6147(98)01171-7. [DOI] [PubMed] [Google Scholar]
- Tanabe T, Adams BA, Numa S, Beam KG. Repeat I of the dihydropyridine receptor is critical in determining calcium channel activation kinetics. Nature. 1991;352:800–803. doi: 10.1038/352800a0. [DOI] [PubMed] [Google Scholar]
- Tanabe T, Beam KG, Adams T, Niidome T, Numa S. Regions of the skeletal muscle dihydropyridine receptor critical for excitation-contraction coupling. Nature. 1990;346:567–569. doi: 10.1038/346567a0. [DOI] [PubMed] [Google Scholar]
- Tanabe T, Beam KG, Powell JA, Numa S. Restoration of excitation-contraction coupling and slow calcium current in dysgenic muscle by dihydropyridine receptor complementary DNA. Nature. 1988;336:134–139. doi: 10.1038/336134a0. [DOI] [PubMed] [Google Scholar]
- Zhang JF, Ellinor PT, Aldrich RW, Tsien RW. Molecular determinants of voltage-dependent inactivation in calcium channels. Nature. 1994;372:97–100. doi: 10.1038/372097a0. [DOI] [PubMed] [Google Scholar]
- Zühlke RD, Reuter H. Ca2+-sensitive inactivation of L-type Ca2+ channels depends on multiple cytoplasmic amino acid sequences of the α1C subunit. Proceedings of the National Academy of Sciences of the USA. 1998;95:3287–3294. doi: 10.1073/pnas.95.6.3287. [DOI] [PMC free article] [PubMed] [Google Scholar]


