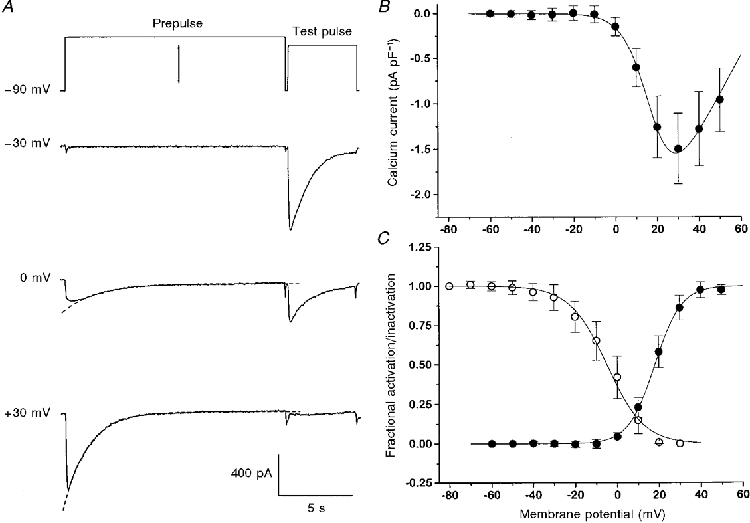
Figure 1. Comparison of inactivation and activation.

A, prepulses (here -30, 0 and 30 mV) of 15 s duration were used to inactivate the current. The degree of inactivation was determined by applying a second pulse (test pulse) to +20 mV after a 200 ms repolarization interval. The waiting interval to the beginning of the next prepulse was 60 s. B, current- voltage relation constructed from average peak inward currents. C, normalized inward current amplitude at the test pulse plotted as a function of the prepulse potential (○). The values obtained at -80 and +30 mV represent 1 and 0, respectively. Averaged data from 9 experiments like the one shown in A.•, voltage dependence of activation of inward current conductance determined from the peak current-voltage relations of B. Each experimental set of data was fitted individually by the appropriate functions as described in Methods. The continuous Boltzmann activation and inactivation curves were constructed by using the mean values of the parameters V½ and k. For inactivation, the values were V½ = -3.8 ± 5.2 mV and k = -9.7 ± 1.4 mV (un = 9); for activation V½ = 18.1 ± 2.3 mV, k = 6.4 ± 1.5 mV, Gmax = 42.8 ± 7.4 pS pF−1 and VCa = 71.0 ± 8.9 mV (see eqn (1), n = 15).
