
Figure 3. Addition of rhEpo induces an increase of the peak Ca2+ current.
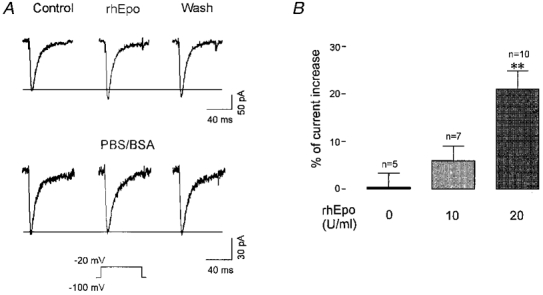
A, upper traces, the effect of rhEpo is shown as an increase of the peak current of the central trace compared with the control trace on the left. The trace on the right shows that it was not possible to reverse the Epo effect with up to 30 min wash-out. The lower traces represent the negative control for another cell whereby superfusion with the vehicle solution for Epo (PBS-0·1 % BSA) did not induce an increase of the peak current. B, pooled data showing the change in the Ca2+ current caused by the vehicle solution (negative control) and by two different concentrations of rhEpo. Only 20 u ml−1 rhEpo induced a significant increase of the current compared with the control experiment. **P < 0·0001, according to Student's t test.