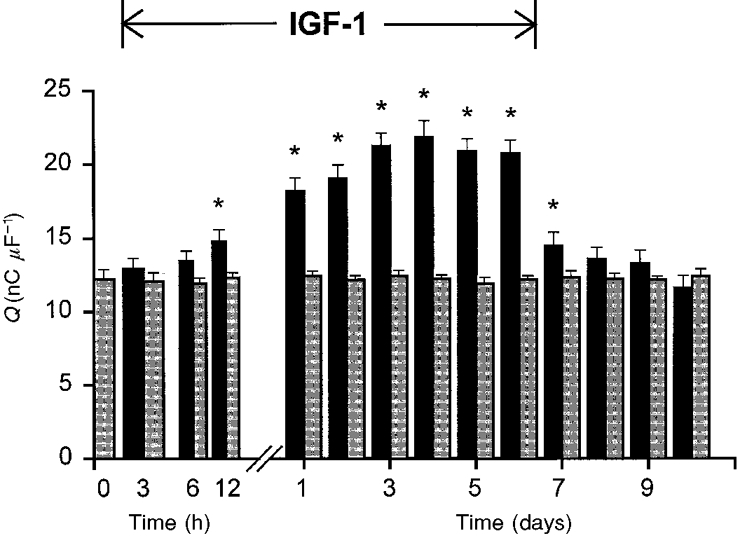
Figure 3. Time course of IGF-1 effects on charge movement.

Charge movement (Qmax) was recorded in cells incubated for 6 days in 20 ng ml−1 IGF-1 (black bars) and in control cells (grey bars) studied at the same time of culture. The time of exposure to IGF-1 is shown on the x-axis. The 10 s intervals between pulses are not shown. Myoballs were also studied for 4 days after the interruption of IGF-1 administration. The number of cells studied for each group varied from 10 to 14. Asterisks indicate statistically significant differences between the two groups (P < 0·05).
