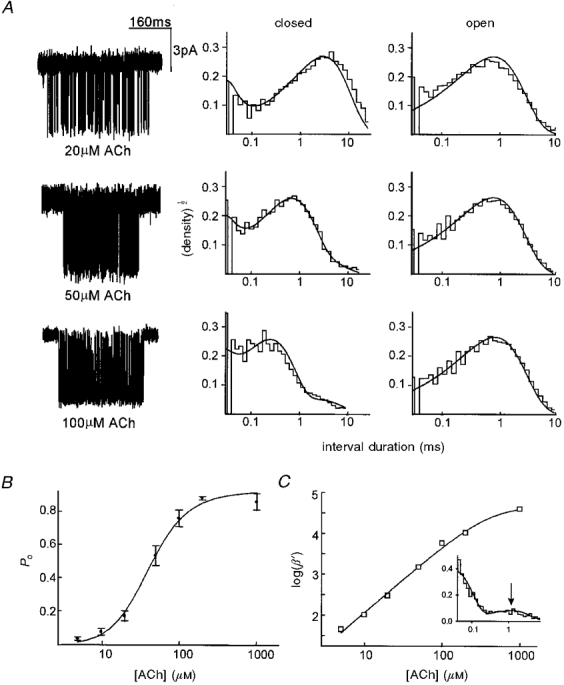
Figure 2. Single-channel currents and the activation properties of αV433 AChR.

A, single-channel currents activated by various concentrations of ACh (filtered at 3 kHz for display). The membrane potential was -70 mV; inward current is down. To the right of the current traces are the corresponding intracluster closed and open duration histograms. Smooth curves are global fits (rate constants shown in Table 1). Intracluster closed intervals decrease in duration as the agonist concentration increases because dwells in un- and monoliganded states become shorter. B, single-channel dose-response curve. The probability of the channel being open within a cluster (Po) is plotted as a function of agonist concentration. Error bars are ± 1 s.d. The continuous curve is fitted to data by eqn (2) (Kd= 221 ± 84 μM, θ= 36 ± 22, Kg was fixed at 0·05). C, effective opening rate (β‘) curve. The continuous curve is fitted to the data by eqn (1). From the high concentration limit, we estimate that β= 48 950 ± 13 490 s−1 (n= 1·62 ± 0·08, EC50= 410 ± 113 μM). The data are from 7 patches (one patch at each concentration), 233 clusters, 85 490 intervals. The inset shows a closed interval duration histogram ((normalized counts per bin)½vs. time (ms)) from a patch at 1 mM ACh; the arrow indicates the ∼1 ms shut state component that corresponds to state C6 in Model 1.
