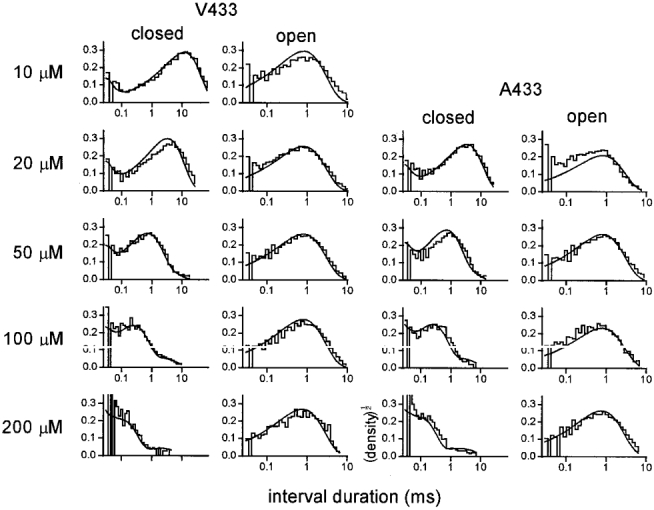
Figure 7. Interval duration histograms for αA433 and αV433 patches.

Smooth curves are computed using the rate constants of Model 1 (equal binding with channel block; β= 50 000 s−1) obtained from a global fit to these 9 patches (Table 3). y-axes are in units of (normalized counts per bin)½. Open and closed interval durations elicited by between 10 and 200 μM ACh are well described by the 7 rate constants.
