
Figure 8. Activation of αG153S AChR.
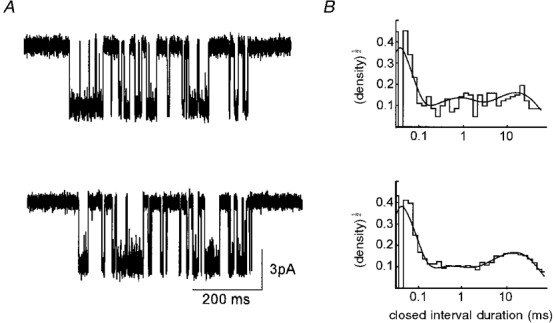
A, αG153S/V433 (top) and αG153S/A433 (bottom) receptor current clusters elicited by 1 μM ACh (filtered at 3 kHz for display). B, corresponding closed duration histograms. Continuous curves are fitted to the data using the rate constants in Table 1. The closed interval distribution comprises three distinct components having the time constants of 15·9, 0·68 and 0·019 ms for αV433/G153S, and 14·5, 0·40 and 0·023 ms for αA433/G153S.