
Figure 3. Circadian variation of core body temperature (A), plasma melatonin (B), sleep efficiency (C), latency to sleep onset (D) and latency to REM sleep (E and F) in older (•) and young (^) subjects.
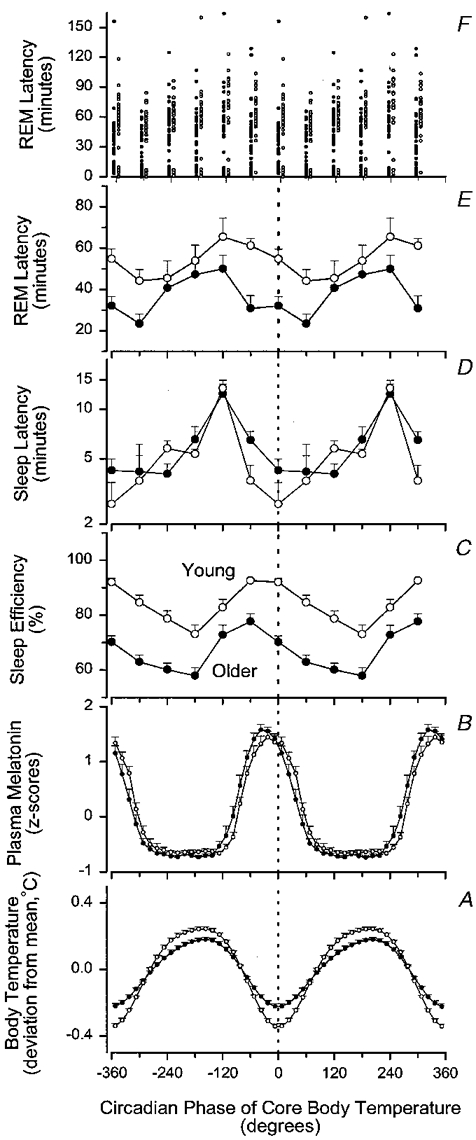
All data are plotted relative to the circadian phase of the core body temperature rhythm and are double plotted. Sleep latency, REM latency and sleep efficiency data are plotted with a 60 deg resolution at the mid-point of each bin. Mean REM latencies represent means of the median values in each subject (E). Individual REM sleep latencies are also represented (F) and the data from the older subjects are plotted to the left of the data from the young subjects in this panel. Plasma melatonin and core body temperature data are plotted with a 15 deg resolution at the mid-point of each bin. The waveform of plasma melatonin was derived by folding the data at the period of the core body temperature rhythm. Variation of plasma melatonin data was expressed as z-scores within each subject and then averaged across subjects. Circadian variation of core body temperature data was computed from the circadian waveform that was fitted to the raw temperature data, and expressed as deviation from the mean. All subjects contributed to every plotted data point for the temperature and sleep parameters, whereas 10 older and 11 young subjects contributed to the plasma melatonin data. Vertical bars indicate one s.e.m.