
Figure 5. Quasi-3-D representation of wakefulness in scheduled sleep episodes as a function of circadian phase of the core body temperature cycle and time in sleep episode in older and young subjects.
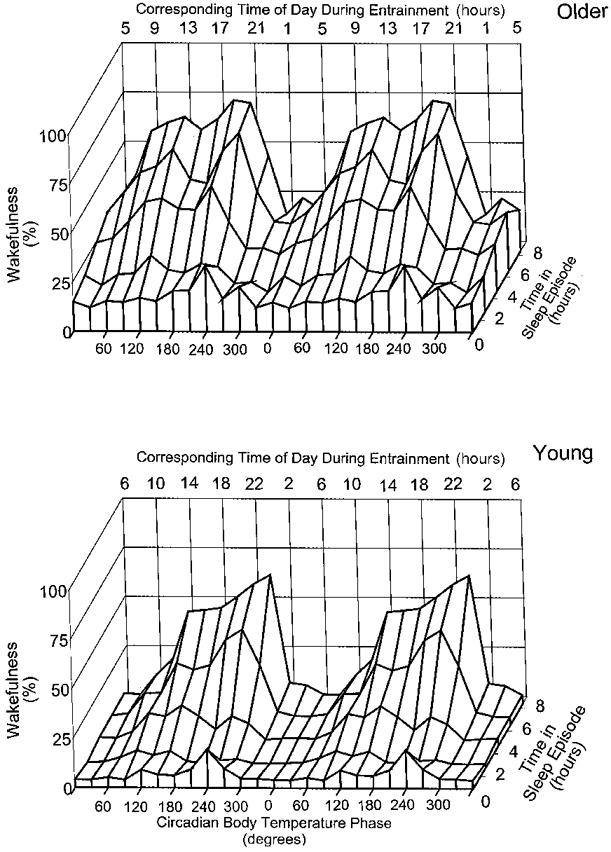
Data are plotted per 30 circadian deg and per fifth of the sleep episode (112 min). All data are plotted at the mid-point of the bins. The mean approximate corresponding times during entrainment in young and older people (according to Duffy et al. 1998) are also indicated.