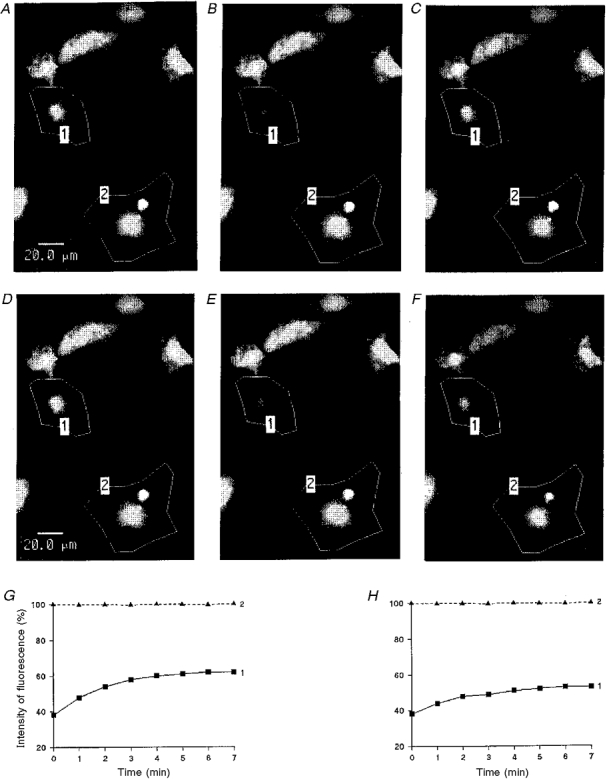
Figure 6. Examples of quantification of the cell-to-cell dye diffusion in cardiac ventricle myocytes of newborn rat cultured for 3 days.

Grey density images of fluorescence intensities (A-C and D-F) were obtained by scanning a group of cells with low intensity light pulses. After a prebleach scan (A and D), 6-CF was photobleached in a selected area (polygon 1) by means of strong illumination. The evolution of the fluorescence levels in the selected cells was compared in the same set of cells, in control conditions (A-C) and after a 60 min exposure to H7 (able to penetrate into intact cells; 1 mM) (D-F), just after photobleaching (B and E) and 8 min later (C and F). Graphs: time courses of the fluorescence emission of the selected cell before (G) and after (H) H7 application. The fluorescence intensity is represented as a percentage of the prebleach emission versus the time after photobleaching. In control conditions (G), the fluorescence emission of the bleached cell increased progressively whereas after H7 treatment (H), the fluorescence level only slightly rose in the bleached cell (continuous lines). In both cases, the light emission of unbleached cell remained stable (dashed lines).
