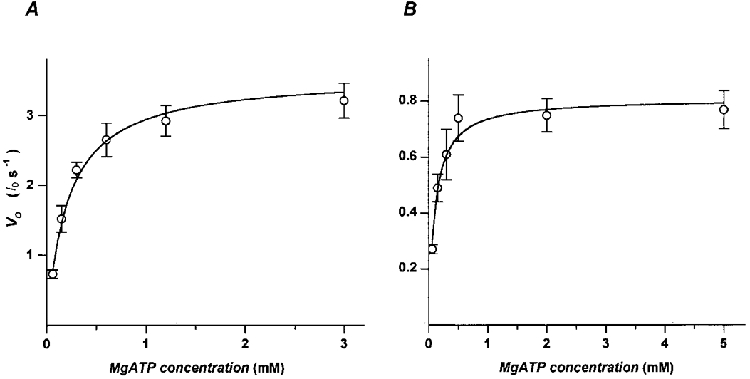
Values of maximal shortening velocities obtained by slack-test experiments in frog tibialis anterior (
A) and rabbit psoas myofibrils (
B) at different MgATP concentrations. Data points obtained from 7-10 myofibrils (mean ±
s.e.m.) were fitted to hyperbolas (continuous lines) of the form:
where
Va is the asymptotic value for
V0 and
Km is the substrate concentration for which the absolute value of
V0 is half
Va. The best fits were obtained with
Va = 3.6 ± 0.2
l0 s
−1 and
Km = 0.21 ± 0.02 mM in frog tibialis anterior myofibrils and with
Va = 0.8 ± 0.03
l0 s
−1 and
Km = 0.12 ± 0.01 mM in rabbit psoas myofibrils.

