
Figure 3. Step analysis for one rostral PML C1 zone site.
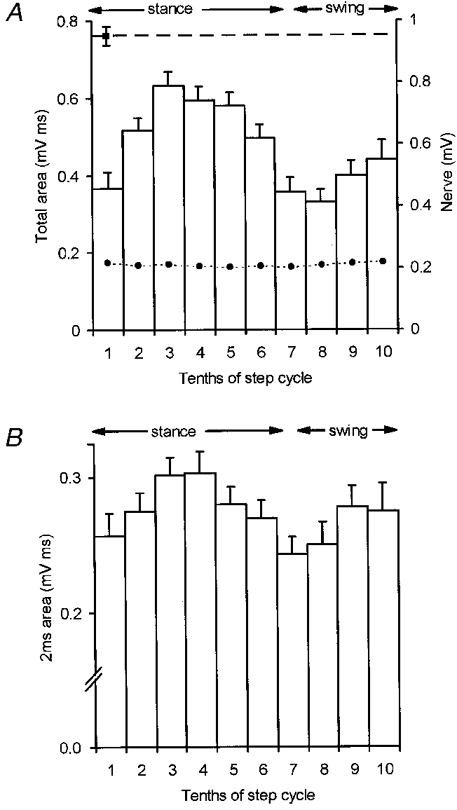
In A and B the step cycle has been divided into tenths with bin one coinciding with the onset of locomotor EMG in the ipsilateral triceps brachii muscle. Periods of stance and swing are approximate timings for trajectory of the ipsilateral forelimb in this and subsequent figures. A, step histogram to show the mean size of the climbing fibre field potential in terms of its total area (+s.e.m.). Dashed horizontal line, mean size of response at rest. •-•, mean peak-to-peak amplitude of the nerve volley. B, same data but mean size of the response in terms of the area under the initial 2 ms of the field.