
Figure 3. Force-pCa relationship (A) and Hill plot analysis (B) of a single pre-flight soleus fibre.
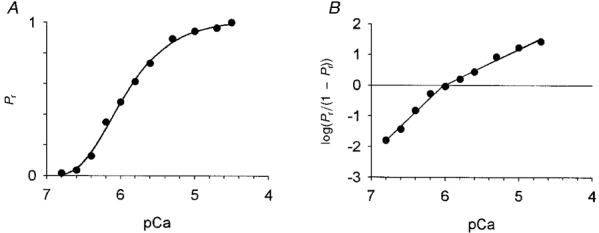
The fibre was activated in solutions with free Ca2+ concentrations ranging from pCa 6.8 to 4.7. The initial and final contraction and every 4th or 5th intervening contraction, was performed at a pCa of 4.5. In A, forces have been plotted relative to peak force at pCa 4.5, i.e. Pr= (force at sub-maximal activation)/(force at pCa 4.5). Hill plots were fitted to the data (B). Half-maximal activation, or pCa50, was defined as the mean abscissal intercept of the Hill plots fitted to data above and below Pr= 0.5. The Ca2+ activation threshold, calculated from the plot of Pr < 0.5, was defined as the pCa where log(Pr/(1 - Pr)) equalled -2.5. For this particular fibre, activation threshold and half-maximal activation occurred at pCa values of 7.09 and 6.02, respectively. The slope of the force-calcium relationship was determined for forces greater (n1) and less (n2) than 50 % of the maximal Ca2+-activated force. Subsequent gel electrophoresis indicated that this fibre expressed type I MHC.