
Figure 11. Effects of 17 days of spaceflight or ground-based bed rest on the diameter and functional properties of single type I soleus fibres.
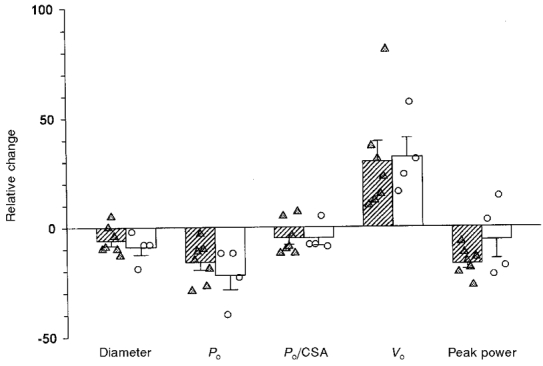
The symbols represent the mean relative change (i.e. (post-flight mean value/pre-flight mean value) × 100 %) experienced by each individual astronaut (circles) and bed rest subject (triangles). Bars represent the mean (±s.e.m.) of the individual relative changes. Bed rest data obtained from Widrick et al. 1997a, 1998. Responses of one bed rest subject have been omitted from this analysis (see Widrick et al. 1997a and 1998 for justification).