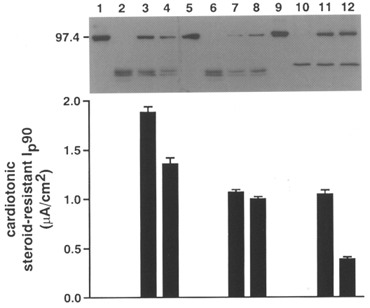
Figure 1. Western blot showing the expression of rat Na+,K+-ATPase α-subunits in stably transfected A6 cells.

Equal amounts of microsomal proteins prepared from A6 cells (lanes 2, 6 and 10) and A6 cell lines expressing rat Na+,K+-ATPase α1 (lanes 3 and 4), α2* (lanes 7 and 8) and α3* (lanes 11 and 12) were separated by SDS-PAGE, transferred to nitrocellulose and probed with an anti-rat α1, α2* or α3* antibody, respectively. Lanes 1, 5 and 9 show proteins from a rat brain preparation. The cardiotonic steroid-resistant Na+ pump current at 90 mM Na+ (Ip90) of the corresponding cell lines is shown below.
