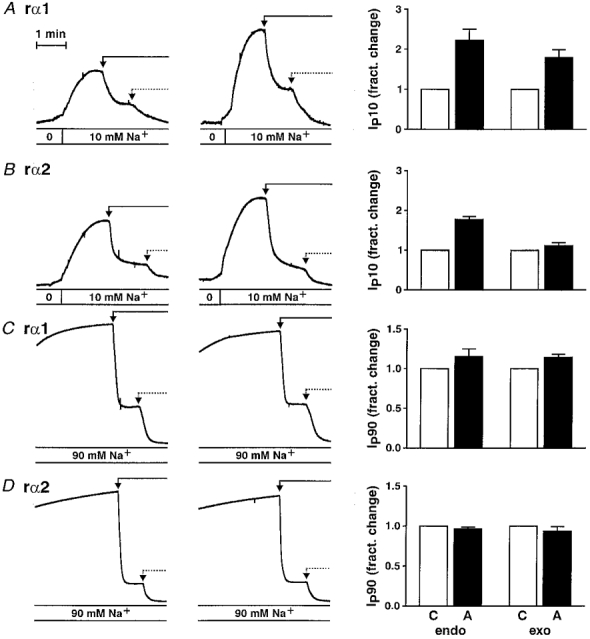
Figure 5. Stimulation by aldosterone (2.5 h) of Ip produced by pumps containing different α-subunits at 10 mM (IP10) and 90 mM (IP90) Na+.

Original recordings are shown in the left panels. Ip was induced by the addition of 10 mM (A and B) and 90 mM (C and D) Na+. Ip carried by endogenous pumps was then blocked by the addition of 50 μM strophanthidin (continuous arrow). Ip carried by pumps containing an exogenous subunit was subsequently blocked by the addition of 3 mM ouabain (dotted arrow). Cell lines expressing rα1 are shown in A and C and cell lines expressing rα2* are shown in B and D. The right-hand panels show the mean fractional changes in Ip (aldosterone (▪) vs. control (□)) carried by pumps containing endogenous (endo) and exogenous (exo) α-subunits, respectively, measured in 8, 12, 7 and 4 paired experiments (A-D). Mean total IP10 (IP90) in cell lines expressing rα1 and rα2* was 0.38 ± 0.06 μA cm−2 (5.17 ± 0.32 μA cm−2) and 0.30 ± 0.02 μA cm−2 (5.02 ± 0.78 μA cm−2), respectively, in control epithelia and 0.71 ± 0.09 μA cm−2 (5.83 ± 0.50 μA cm−2) and 0.46 ± 0.03 μA cm−2 (4.84 ± 0.86 μA cm−2) in aldosterone-treated epithelia.
