
Figure 3. Effect of adrenaline on the power spectrum of CMFs.
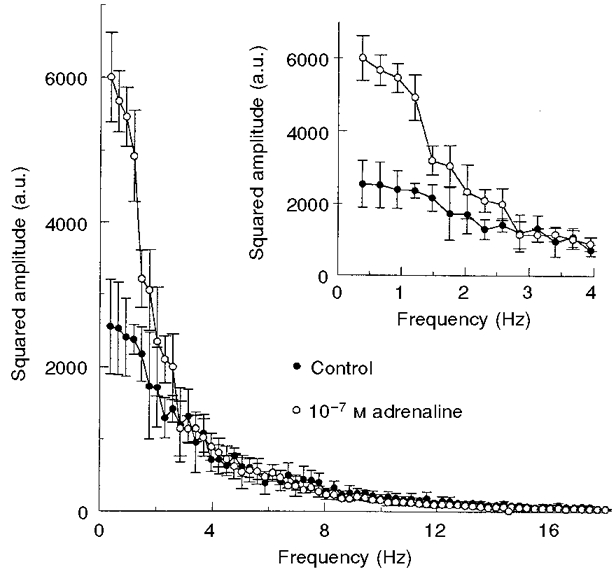
•, control RBCs, mean of 16 spectra; ○, RBCs exposed to 10−7 M adrenaline, mean of 21 spectra. The frequency resolution of the power spectra is 0.3 Hz. Inset: power spectra in the frequency range 0.3-4.0 Hz. Error bars represent the s.d. of each data point. All incubations were carried out for 20 min, at 37 °C. a.u., arbitrary units.