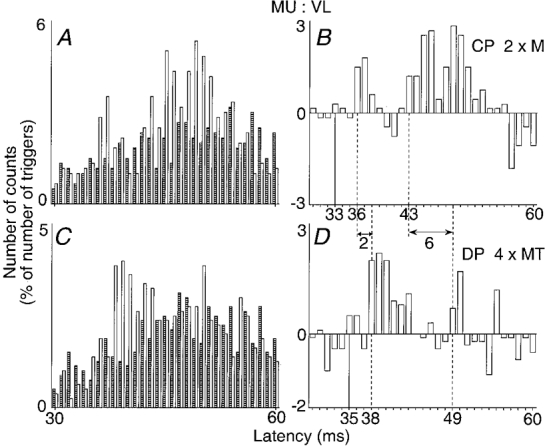
Figure 1. Changes in firing probability of one Q motor unit evoked by proximal and distal stimulation of the common peroneal (CP) nerve.

A and B, proximal stimulation of the CP nerve (2 × MT) at the upper part of the popliteal fossa. C and D, distal stimulation of the deep peroneal (DP) nerve (4 × MT). The histograms in A and C show discharges of the voluntary activated motor unit in control conditions (hatched columns) and after stimulation of the nerve (open columns). The differences between these two histograms are plotted in B and D. In both cases, the number of counts, expressed as a percentage of the number of the triggers (A and B, 600; C and D, 539) is plotted against the latency from the stimulation (bin width 1 ms). Continuous vertical lines, expected time of arrival of the conditioning Ia volley at the segmental spinal level of the motoneurone (latency of monosynaptic homonymous excitation after stimulation of the femoral nerve, 28 ms; distance between stimulation sites of femoral and CP nerves, 40 cm). Dashed vertical lines, latencies of non-monosynaptic group I and group II excitations. Double-headed horizontal arrows, difference between the latencies of the early peaks (2 ms) and of the late peaks (6 ms) in the two positions of the stimulation.
