
Figure 3. The effect of KN-93 on the voltage dependence of inactivation of A-type currents.
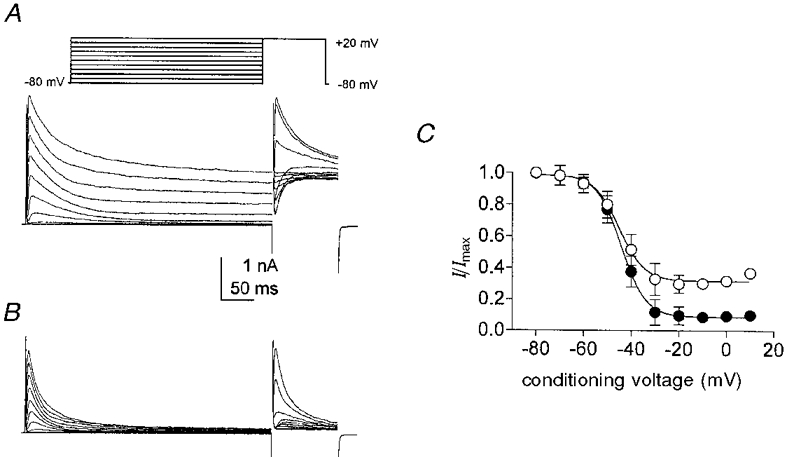
A and B, membrane currents obtained from colonic myocytes dialysed with 10 mM BAPTA. Membrane potential was stepped from -80 mV to conditioning potentials between -80 and +20 mV (10 mV increments) for 400 ms followed by a 100 ms test step to +20 mV (inset). A, control; B, same cell in the presence of 5 μM KN-93. C, summary of inactivation protocol from five cells in control (○) and in the presence of KN-93 (•). Normalized peak test currents are plotted as a function of conditioning voltage. Smooth lines are Boltzmann fits to the data.