
Figure 2. Frequency- and time-domain signal analysis.
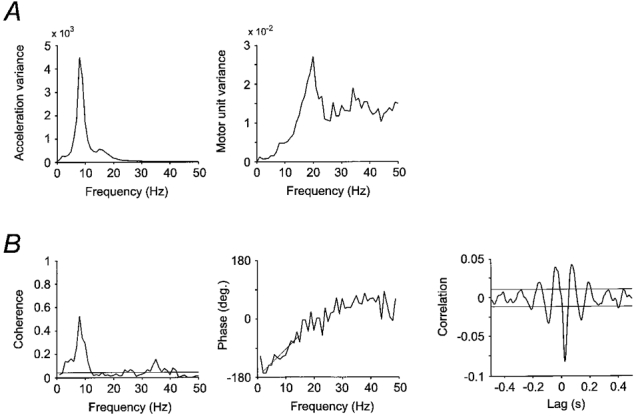
Results for 48 extension movements at 10 deg s−1 overall speed for a sample EDC motor unit. A, power spectrum for acceleration and for single motor unit activity. The peak in the motor unit power spectrum close to 20 Hz represents the overall firing rate of this motor unit during movements. B, analysis of the coupling between acceleration and motor unit activity. There is a prominent peak at 8 Hz corresponding to the main peak in the acceleration spectrum. Weighted linear regression over part of the phase spectrum is shown with a straight line. The slope of this line as well as the main downward peak in the cross-correlation graph indicates that the motor unit is leading the acceleration in the muscle shortening direction by 20 ms. Horizontal lines in the coherence and cross-correlation plots indicate approximate 99 % confidence limits.