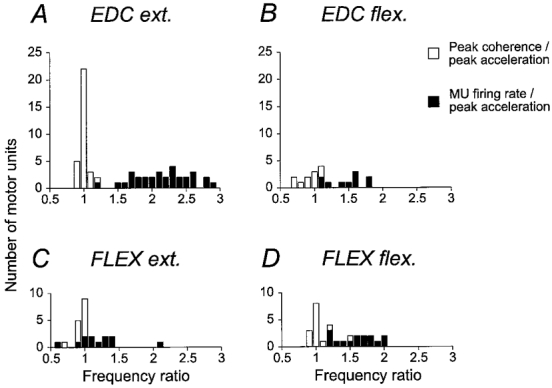
Figure 3. Summary of motor unit firing rates and coherence vs. acceleration.

Histograms for motor unit firing rates (▪), and the frequency of peak coherence between motor unit activity and acceleration (□) for all 10 deg s−1 movements. Observations are normalized by the frequency at the main peak in the corresponding acceleration power spectrum. A, EDC muscle, extension movements. B, EDC muscle, flexion movements. C, finger flexor muscles, extension movements. D, finger flexors, flexion movements. The number of observations are fewer in B and C because some units fell silent during muscle shortening.
