
Figure 6. Signal analysis of movements of different speed.
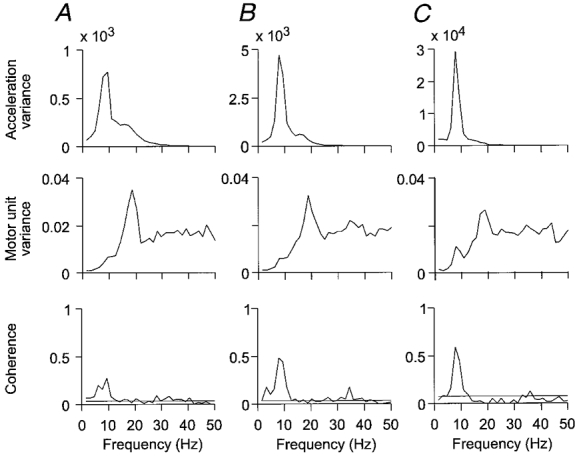
Frequency-domain signal analysis of 20 movements at 4 deg s−1 overall speed in A, 48 movements at 10 deg s−1 in B, and 50 movements at 25 deg s−1 in C. Graphs show, from above: acceleration power spectrum; motor unit spectrum; and coherence between motor unit activity and acceleration. Horizontal lines in the coherence plots indicate approximate 99 % confidence limits. There is a significant increase in peak coherence with increasing movement speed.