
Figure 1. Fluorescence changes measured from individual cells within intact islets of Langerhans.
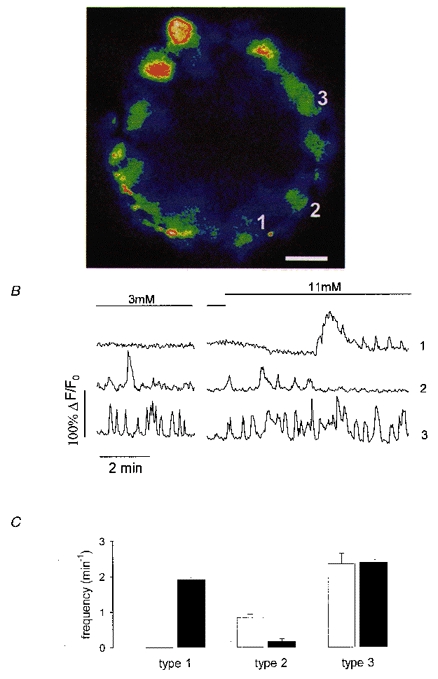
A, colour image of a fluo-3 loaded islet exposed to 3 mM glucose. Blue corresponds to low and red to high fluorescence intensity. The scale bar at the bottom right represents 15 μm. B, records of fluorescence intensity versus time from the islet in A. The boundaries of each cell were clearly visible from the low fluorescence at the cell edge. Islets exposed to 3 mM glucose were switched to 11 mM glucose as indicated by the bars on the record. Traces 1, 2 and 3 correspond to the cells labelled in A. The time break was 10 min. C, frequency of [Ca2+]i oscillations for cells with the same [Ca2+]i pattern as cell 1 (type 1), cell 2 (type 2) and cell 3 (type 3) in 3 mM glucose (□) and 11 mM glucose (▪). Results are pooled from 261 cells in 15 different islets and are expressed as means ± s.e.m.