
Figure 6. pHi dependence of dual acid efflux.
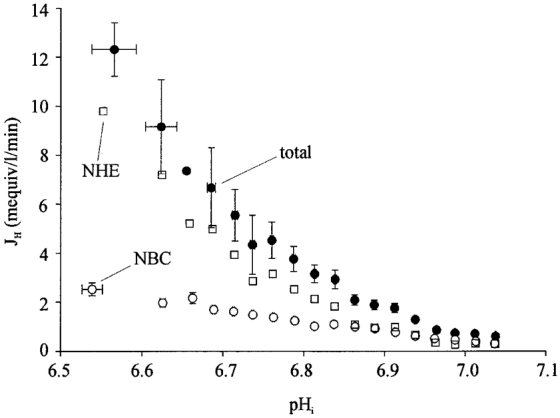
Data derived from 22 cells exposed to experimental protocols like that shown in Fig. 4B.•, total acid efflux derived from pHi recovery from an intracellular acid load. ○, acid efflux through Na+-HCO3− cotransport (NBC), derived from pHi recovery from an acid load in the presence of 30 μM DMA. □, acid efflux through Na+-H+ exchange (NHE), derived from the difference between the recovery rate with and without DMA. Data derived from experiments like that shown in Fig. 5B.•, fluxes averaged over successive 0.05 pHi ranges, starting with 6.55-6.60, n = 2, 2; and averaged over successive 0.025 pHi-ranges, starting with 6.65-6.70, n = 2, 3, 6, 7, 13, 16, 22, 29, 36, 49, 40, 66, 92, 108, 94, 115. ○, fluxes averaged over 0.05 pHi bins starting with 6.55-6.60, n = 14, 16; and averaged over successive 0.025 pHi ranges starting with 6.65-6.75, n = 16, 6, 31, 43, 49, 60, 82, 72, 83, 87, 100, 140, 108, 112, 156, 146.