
Figure 7. pHi dependence of acid efflux determined without pharmacological dissection.
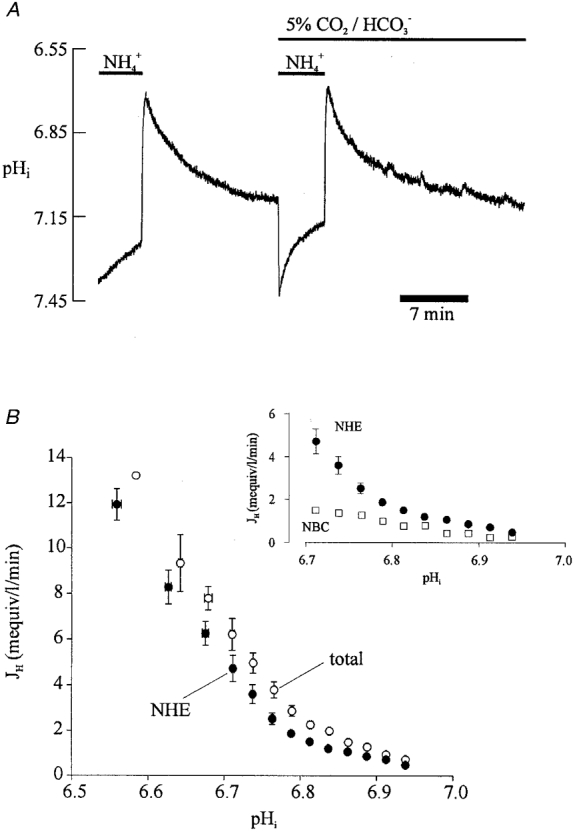
A, recovery of pHi from an intracellular acid load (15 mM ammonium prepulse) in Hepes- and CO2/HCO3−-buffered conditions. B, plot of acid efflux versus pHi derived from pHi recoveries like those shown in A, for Hepes-buffered (•, NHE activity) and CO2/HCO3− -buffered conditions (○, combined activities of NHE and NBC). Data derived from a total of 7 cells. •, buffer values averaged over successive 0.05 pHi ranges, starting with 6.55-6.60, n = 1, 3, and then averaged over successive 0.025 pHi ranges starting with 6.65-6.675, n = 11, 8, 17, 18, 24, 33, 34, 48, 58, 77, 100, 153, 203, 163, 25. ○, buffer values averaged over successive 0.05 pHi ranges starting with 6.55-6.6; n = 5, 9; and successive 0.025 pHi ranges starting with 6.65-6.675, n = 17, 11, 16, 24, 39, 52, 71, 68, 72, 88, 124, 97, 89, 98, 28. Inset to B plots as a function of pHi (□) the difference between the values for total efflux and NHE-mediated efflux (data taken, at common pHi values, from the main graph of B). This gives the pHi dependence of NBC. For comparison, the data for NHE activity are also re-plotted (•, data taken from main graph of B).