
Figure 11. Modelling intracellular pH regulation: dual acid loading.
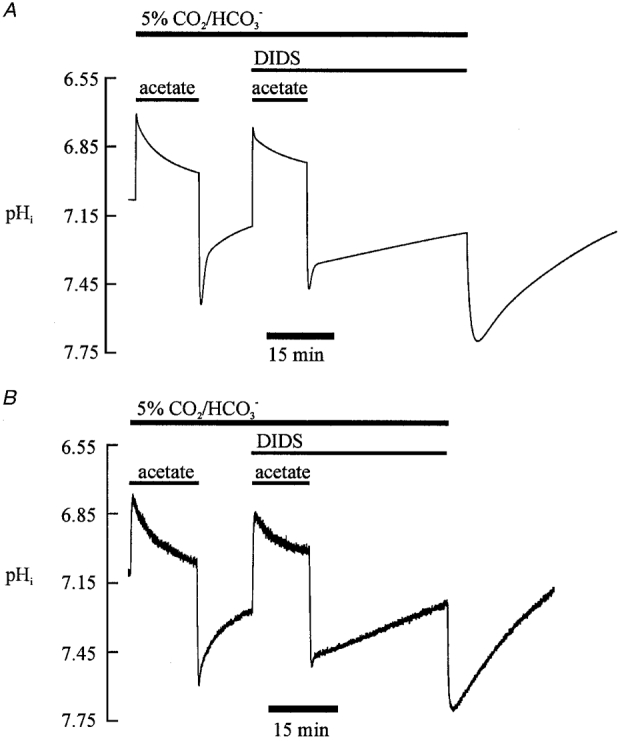
A, results of the modelling. The first part of the trace is modelled for 5 % CO2/HCO3−-buffered conditions (pHo 7.40), showing the addition and subsequent removal of (80 mM) extracellular acetate. A second acetate prepulse (80 mM) was modelled while simultaneously switching off AE and NBC activity (equivalent to adding the drug DIDS). Finally, withdrawal of 5 % CO2/HCO3− buffer (constant pHo of 7.40) is simulated by setting PCO2 to zero in the model and switching off AE and NBC activity. B, for comparison, a specimen experimental recording of pHi is shown with a protocol similar to that modelled in A. The dose of DIDS applied was 0.1 mM. The acetate applications were made at a concentration of 80 mM.