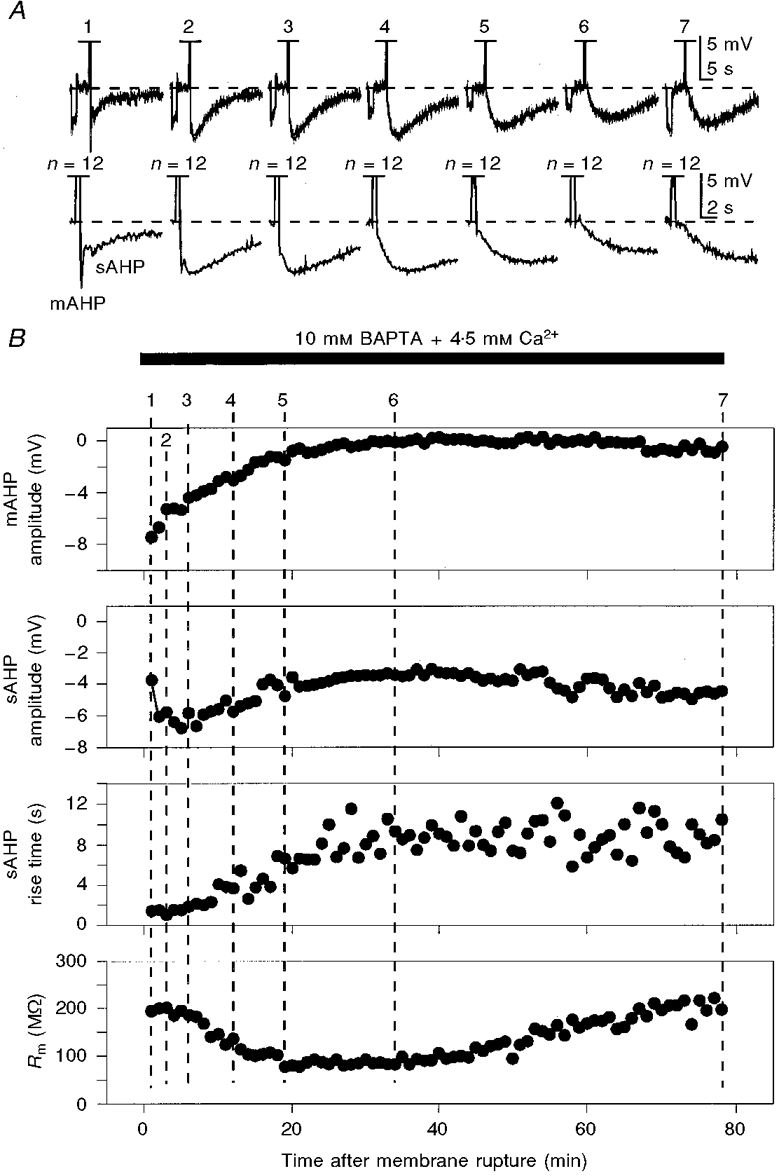
Figure 6. The time course of sAHP potentiation and mAHP inhibition during prolonged whole-cell recording with an internal solution containing 10 mM BAPTA balanced with 4.5 mM Ca2+.

The mAHP/sAHP was activated by standard trains of action potentials (n, off scale in traces shown in A) similar to those in Figs 5 and 7. The bottom traces in A show the early parts of the upper traces on an expanded time scale to show the changes in mAHP. The reponses in A were taken at the times indicated by the corresponding numbers on the graphs in B. A -25 pA current pulse was applied before the spike train (A) to monitor the membrane input resistance (Rm). The fluctuations of the rise time of the sAHP seen in the graph are due to possible errors introduced by the normal noise combined with the slow digitization rate, which was needed to show the full time course of these extremely slow sAHPs. The membrane potential was held at -63 mV (dashed lines in A). KMeSO4-based internal solution.
