
Figure 4. Facilitation by a weak CP stimulation of the peak elicited by TMS in PSTHs from a Q (VL) motor unit.
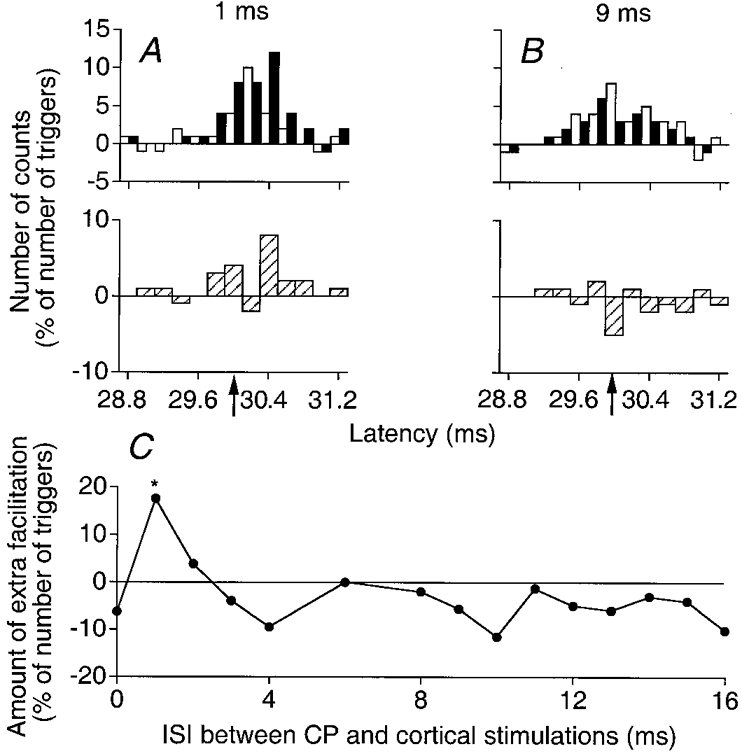
A and B, PSTHs from a Q motor unit (0.2 ms bins). The number of counts (after subtraction of the background firing probability), expressed as a percentage of number of triggers, is plotted against the latency after TMS. □, algebraic sum of effects by separate CP (0.8 × MT) and cortical (24 % of the maximal output) stimulations; ▪, the effect of combined (CP + TMS) stimulations at 1 ms (A) and 9 ms (B) ISIs. Subtraction histograms in the lower panel of each pair ( )represent the difference between filled and open columns. Filled upward arrows indicate the onset of the window of analysis starting 0.6 ms after the onset of the cortical peak. Note that the abscissa in A and B is relative to TMS. C, the amount of extra facilitation on combined stimulation (in A and B) is plotted against the ISI between CP and cortical stimulations. The asterisk indicates the result which is statistically significant (P < 0.05).