
Figure 2. Three components of the peak outward currents in P28 rat atrial myocytes.
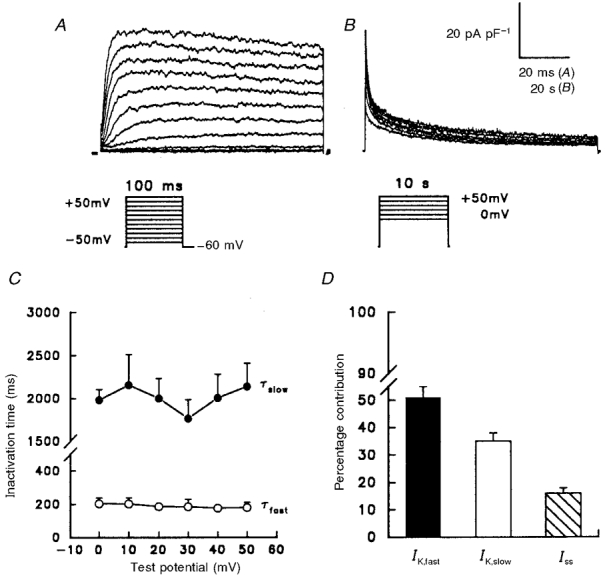
Outward currents were evoked as described in the legend of Fig. 1 during 100 ms (A) and 10 s (B) depolarizing voltage steps; for the records presented in B, the interpulse interval was 60 s. The records in A and B were obtained from the same cell; note also that, in B, the data are plotted as points and the continuous lines reflect double exponential fits to the decay phases of the currents (see text). C, mean ±s.e.m. (n = 6) time constants for the fast (○) and slow (•) components of peak outward decay, determined from double exponential fits (as in B) to the decay phases of the outward currents evoked during 10 s depolarizations to potentials between 0 and +50 mV. D, mean ±s.e.m. (n = 22) percentage contribution of IK,fast, IK,slow and Iss to the peak outward K+ currents in P28 rat atrial myocytes at +30 mV (see text).