
Figure 8. AsODNs targeted against Kv4.2, Kv1.2 and Kv1.5 attenuate different components of the outward K+ currents in atrial cells.
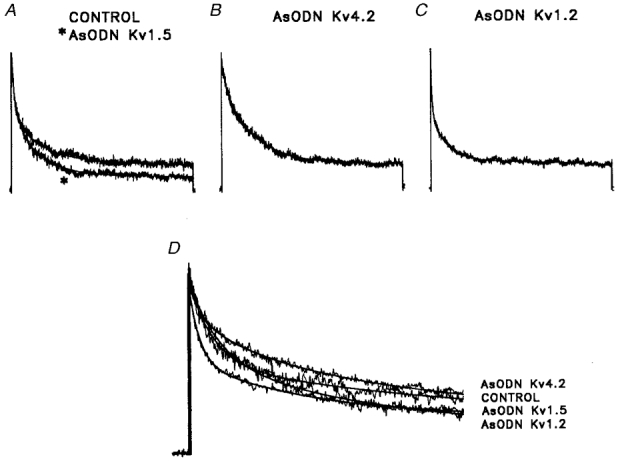
A-C, outward K+ currents, evoked during 10 s depolarizing voltage steps to +30 mV from a holding potential of -60 mV, were recorded from control atrial myocytes (A) and from cells exposed to the Kv1.5 (A, asterisk), Kv4.2 (B) and Kv1.2 (C) AsODNs. The records obtained from cells exposed to AsODNs (in A-C) were scaled to the peak amplitude of the current in the control cell (A) to facilitate comparison of the current waveforms. As is evident, the waveforms of the outward currents evoked during 10 s voltage steps in the presence of the Kv1.5 (A), Kv4.2 (B) and Kv1.2 (C) AsODNs are distinct from the control (A). To determine the amplitudes of the fast (IK,fast), the slow (IK,slow) and the steady-state (Iss) current components, the decay phases of the currents were fitted to the sum of two exponentials (see Methods). Representative fits (plotted as lines) to the decay phases of the currents in a control P28 atrial myocyte and in P28 atrial cells exposed to the Kv1.5, the Kv4.2 or the Kv1.2 AsODN are illustrated in D. Note that only the first 2 s of the (10 s) depolarizing voltage steps are illustrated for clarity, and (as in A-C) that the peak outward currents are scaled (to the control cell). The Kv1.5, Kv4.2 and Kv1.2 AsODNs did not affect the time constants of IK,fast or IK,slow decay; only the amplitudes of the currents were reduced. Similar experiments were completed on many cells, and mean ±s.e.m. normalized data are presented in Table 3.