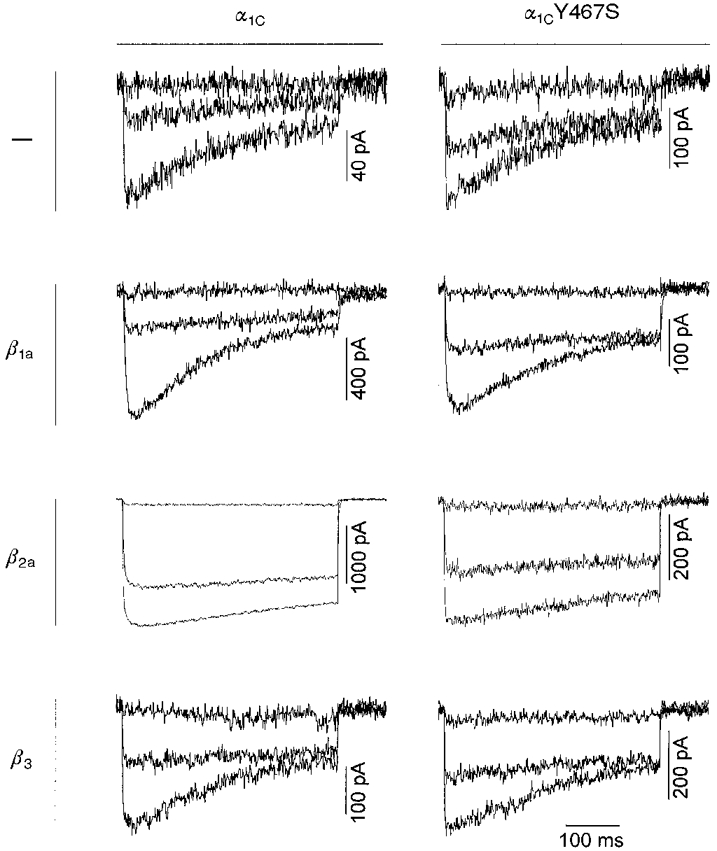
Figure 2. Comparison of the time course of current traces for α1C and α1CY467S expressed without or with β1a, β2a or β3 in tsA201 cells.

The membrane potential was stepped for 400 ms from a holding potential of -80 mV to 0, +20 or +40 mV (upper, middle and lower traces, respectively). The magnitude of currents varied greatly between individual cells (see also error bars in Fig. 3A and B). Current inactivation was slowed down on coexpression of α1C or α1CY467S with β2a. There was no apparent difference between currents recorded from α1C- or α1CY467S-transfected cells.
