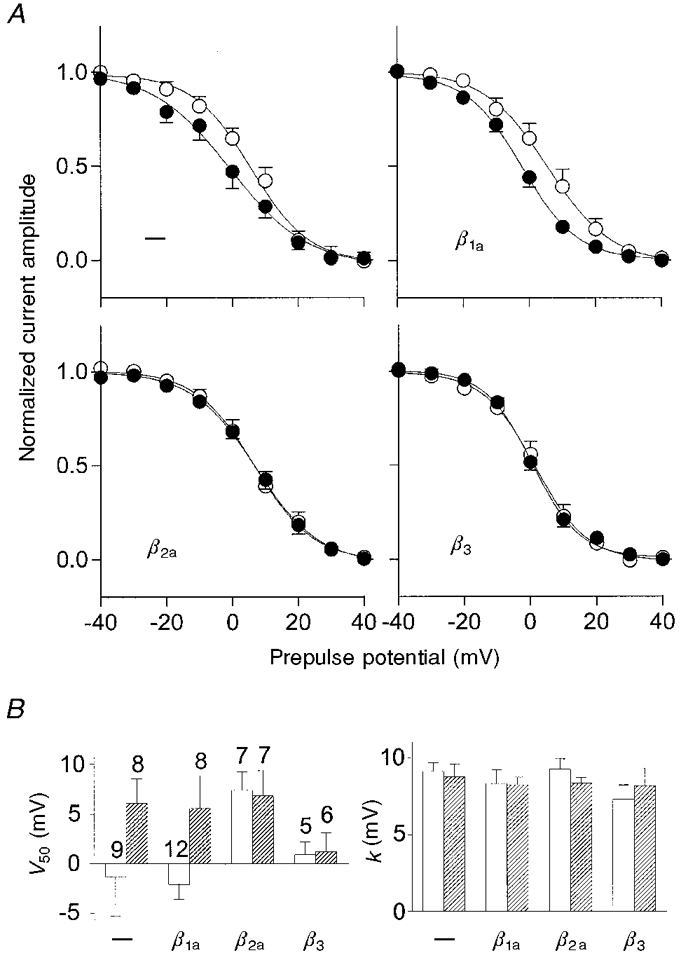
Figure 5. Steady-state inactivation in tsA201 cells transfected with α1C or α1CY467S with and without β subunits.

A, normalized current amplitude during a voltage step from -100 to +40 mV after 10 s prepulses to various potentials with an interpulse interval of 2 ms (•, α1C; ○, α1CY467S; means and s.e.m. of individual recordings are shown). There were only minor differences in steady-state inactivation between the different subunit combinations. B, steady-state inactivation curves for each individual recording were fitted by a Boltzmann function: i = 1/(1 + exp((V - V50)/k)), where i is the test pulse current amplitude, V is the prepulse potential, V50 is the prepulse potential of half-maximal inactivation and k is the slope factor, and the obtained parameters were subsequently averaged (□, α1C;  , α1CY467S; error bars are s.e.m.). The apparent difference in the slopes of the averaged curves shown in the upper left figure in A is not reflected in the slope factor, k, shown in the right panel of B, due to the large variability of V50 for α1C expression (see error bar in left panel of B). This analysis does not indicate statistically significant differences in steady-state inactivation parameters between cells transfected with different subunit combinations.
