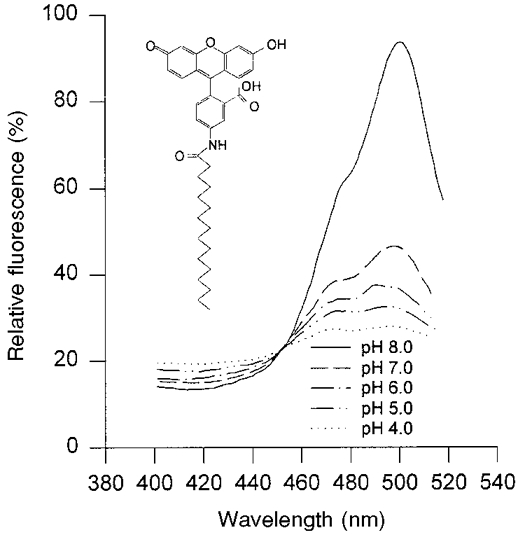
Figure 1. Excitation spectrum of HAF bound to the apical membrane of the colonocytes of the distal colon of guinea-pig at different pH levels.

The pH of the solution in the cuvette is indicated in the figure. The fluorescence intensity was measured at 530 nm with excitation wavelength varying from 400 to 510 nm. The molecular structure of HAF is shown in the inset.
