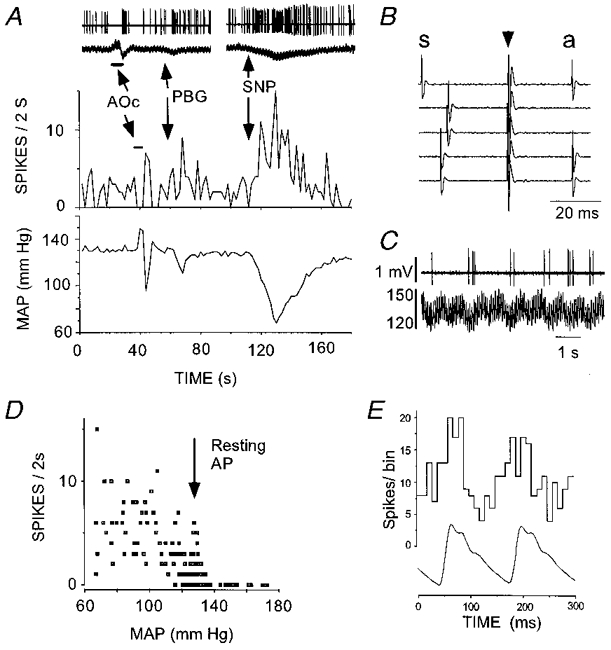
Figure 6. Physiological properties of a type II phenotypically identified C1 neurone recorded in a rat ventilated with 100% oxygen.

A, inhibition by aortic occlusion (AOc) (top two traces show raw data) and i.v. injection of phenylbiguanide (PBG, 10 μg kg−1). Reduction of arterial blood pressure (sodium nitroprusside, SNP) produced powerful activation of the cell. B, antidromic activation produced by hypothalamic stimulation. Hypothalamic stimulation (arrow) triggered by the spontaneous spike (s) elicits constant latency (antidromic, a) spikes (traces 1, 4 and 5). Stimulation within the critical interval after occurrence of the spontaneous spike results in collision (traces 2 and 3). C, apparent ‘respiratory rhythm’ of the discharge rate. Top trace, unit activity; bottom trace, AP (mmHg). D, relationship between discharge rate and mean arterial blood pressure (note higher resting AP compared with cell recorded under room air in Fig. 5). E, pulse-triggered histogram of unit discharge. In A-C, peak to peak amplitude of spikes is 1.4 mV.
