
Figure 5. Concentration-response curves to acetylcholine in mesenteric small arteries from pregnant rats fed a control (□; n = 9) or saturated fat diet (▪; n = 9).
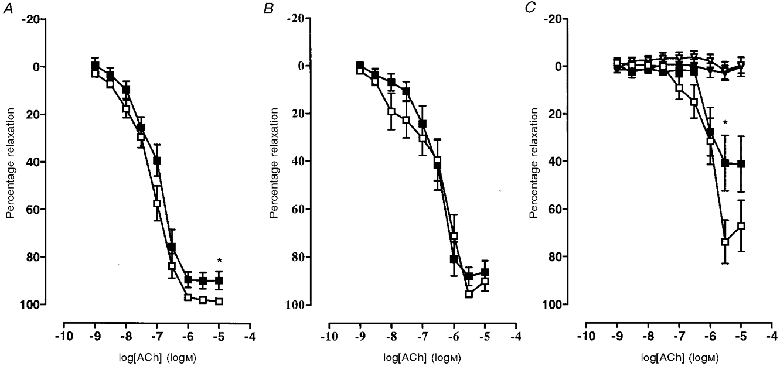
A, without inhibitors. B, in the presence of 10 μm indomethacin. C, in the presence of 100 μm L-NAME, 10 μm indomethacin and 1 μm ODQ and with the same inhibitors but in the presence of depolarizing 25 mM KCl to obviate the effects of EDHF (▿, control diet; ▾, saturated fat diet). Values are given as means ±s.e.m. Maximum relaxation: *P < 0.05.