
Figure 3. Muscle sympathetic nerve area spectral power.
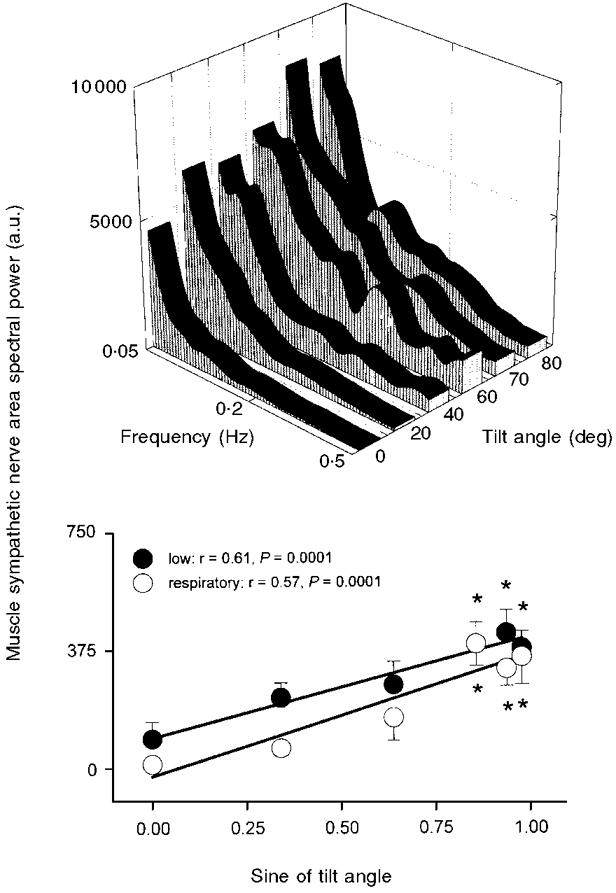
Average muscle sympathetic nerve area spectral power at each tilt angle (top panel), and integrated spectral power in low- and respiratory-frequency bands, plotted as functions of the sine of tilt angle (bottom panel). a.u., arbitrary units. Bottom panel: thick lines denote significant regressions. r, correlation coefficient derived from least-squares linear regression. * Significantly different from supine.