
Figure 5. Systolic pressure spectral power.
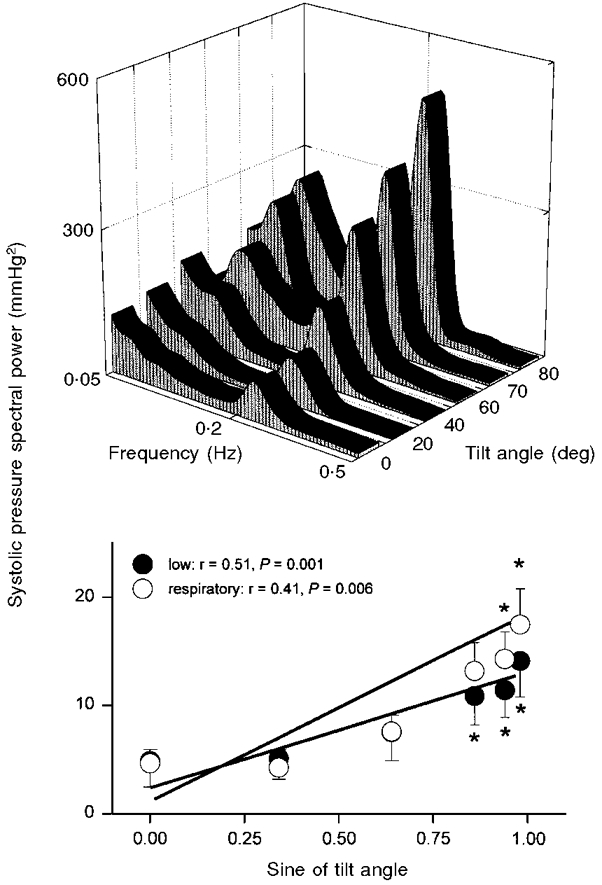
Average systolic pressure spectral power at each tilt angle (top panel), and at low- and respiratory-frequency bands, plotted as functions of the sine of tilt angle (bottom panel). Bottom panel: thick lines denote significant regression. * Significantly different from supine.