
Figure 4. Effects of PCr withdrawal: concentration dependence.
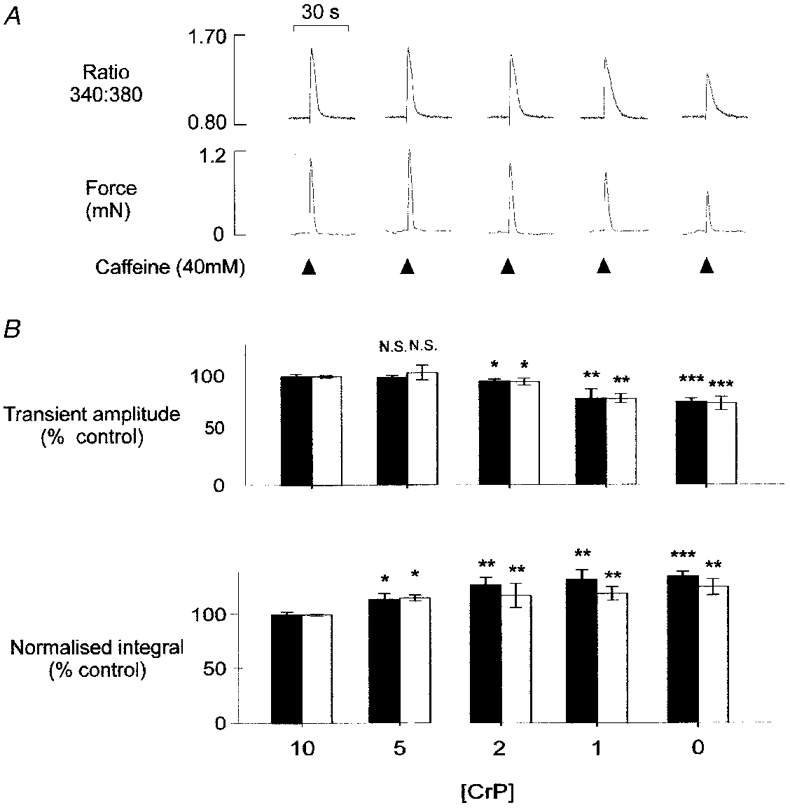
A, steady-state Ca2+(upper panel) and tension (lower panel) transients in the presence of 10, 5, 2, 1 and 0 mM PCr. All responses are from the same mechanically skinned preparation, after a minimum of 8 min equilibration at each [PCr]. B, accumulated data showing the mean (±s.e.m.) amplitude (upper panel) and integral of the normalized Ca2+ (▪) and tension (□) transients (lower panel) in the presence of various [PCr]. In each preparation, steady-state transients at 5, 2, 1 and 0 mM PCr were expressed relative to the mean of 4-5 control responses obtained in the presence of 10 mM PCr. *P < 0.05, **P < 0.01, ***P < 0.0001 compared with control response at 10 mM PCr. N.S., not significant. With 5 mM, 2 mM and 1 mM PCr, n = 6. With 0 mM PCr, n = 16.