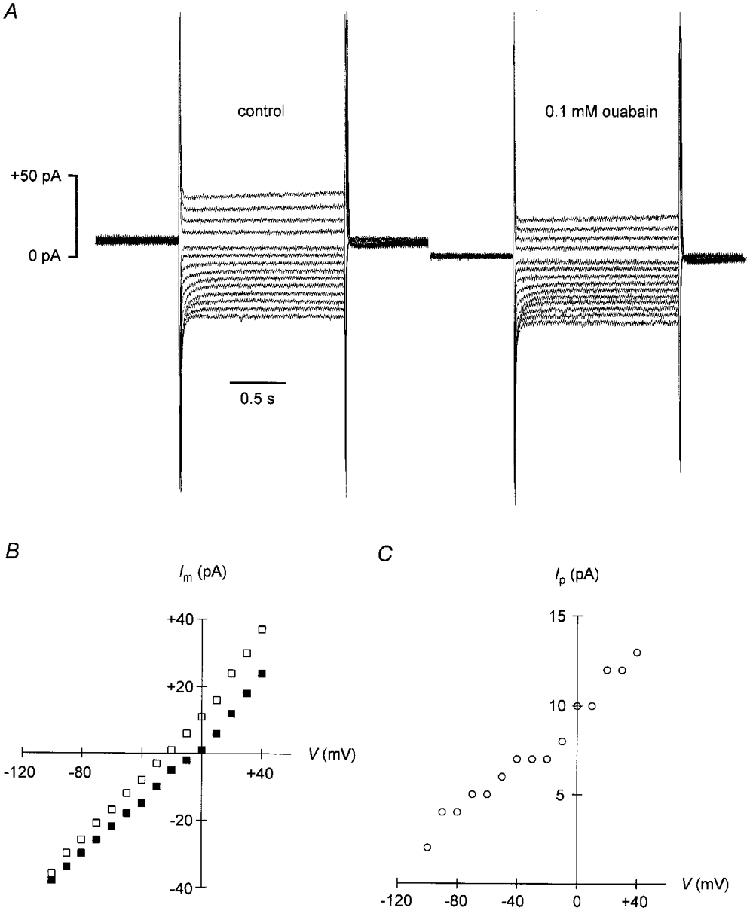
Figure 1. Voltage dependence of Na+-K+ pump current activated by 0.5 mM Na+pip.

A, whole-cell recording from a guinea-pig ventricular myocyte. The patch pipette contained 0.5 mM Na+ and 159.5 mM NMDG+ as the main cation. Current traces in response to voltage steps from zero potential to potentials between −100 and +40 mV in 10 mV increments are displayed. Left panel: control in Na+-free solution containing 20 mM Cs+. Right panel: currents obtained following application of 0.1 mM ouabain. Note the inward shift of the current traces after inhibition of the Na+-K+ pump by ouabain. Cell capacitance: 111 pF. B, steady-state membrane current (Im)-voltage relationships from the data shown in A. □, control in drug-free medium; ▪, currents measured under 0.1 mM ouabain. C, pump current (Ip)-voltage relationship. Data represent the differences between membrane currents recorded in the absence and in the presence of ouabain (shown in B). Note the steep positive slope of the Ip-V curve.
