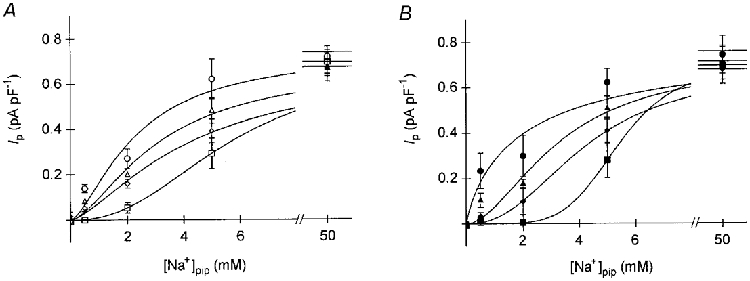
Figure 3. Activation of Ip by [Na+]pip at various membrane potentials.

Ip activation as a function of [Na+]pip in cardiomyocytes dialysed with NMDG+-containing (A) or TEA+-containing (B) pipette solutions. Activation was measured at +40 mV (circles), 0 mV (triangles), −50 mV (diamonds), and −100 mV (squares) (n = 4–8). The curves fitted to the data points obey the Hill equation (eqn (1)) with the following parameters (for A and B): + 40 mV: K0.5= 2.3 and 2.1 mM Na+pip, Ip(max)= 0.75 and 0.81 pA pF−1, nH= 1.5 and 0.8; 0 mV: K0.5= 3.1 and 3.3 mM Na+pip, Ip(max)= 0.68 and 0.72 pA pF−1, nH= 1.6 and 1.8; −50 mV: K0.5= 4.3 and 4.2 mM Na+pip, Ip(max)= 0.70 and 0.68 pA pF−1, nH= 1.4 and 2.3; −100 mV: K0.5= 5.8 and 5.4 mM Na+pip, Ip(max)= 0.70 and 0.70 pA pF−1, nH= 2.3 and 5.2. r2= 0.984–1.000. Note that K0.5 values increase with hyperpolarization, whereas Ip(max) remains constant.
