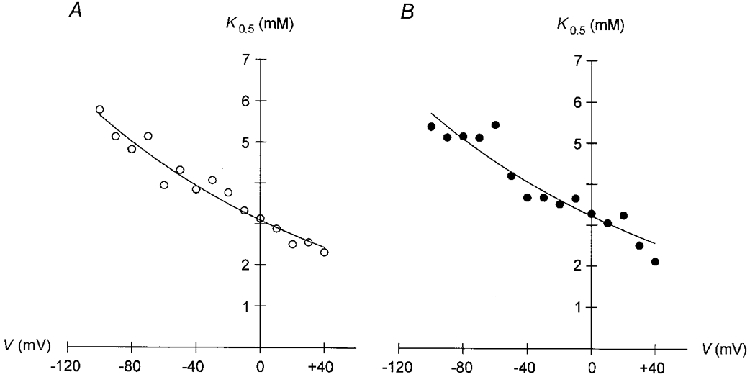
Figure 4. K0.5 values for Ip activation by Na+pip are voltage dependent.

K0.5 values for activation of Ip by Na+pip in cells containing either NMDG+ (A) or TEA+ (B) are plotted versus membrane potential. In both cases K0.5 values decrease monotonically with depolarization. The fitted curves obey a Boltzmann equation (eqn (2)) with α values of 0.16 for NMDG+ (A) and 0.15 for TEA+ (B). r2= 0.948 (A) and 0.895 (B).
