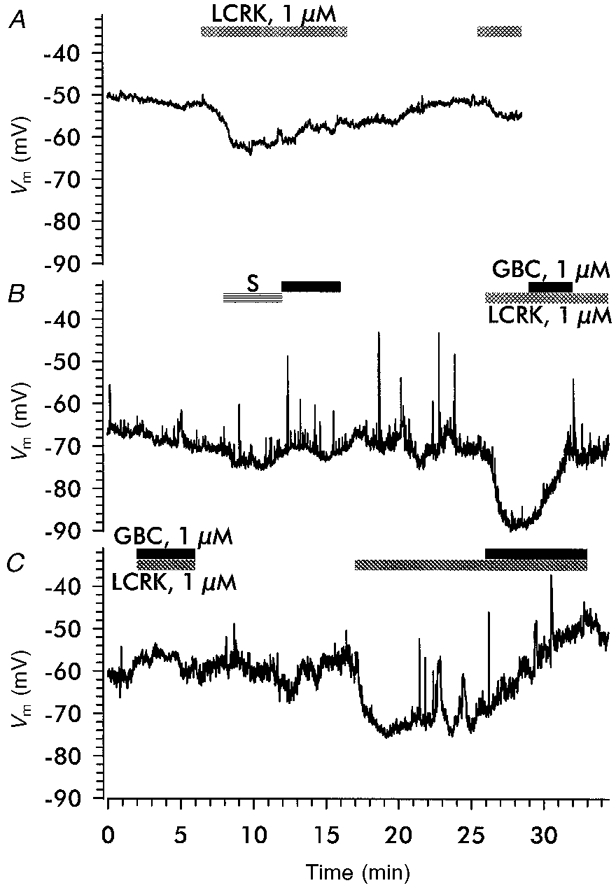
Figure 3. Effects of LCRK and GBC on membrane potential in RSC.

Membrane potential was measured with the whole-cell patch-clamp technique in the current-clamp mode. A, trace showing the effect of LCRK (1 μm) on membrane potential. Note the fading of the effect during prolonged application of the agonist (−50 % within 5 min after reaching the maximum) and the small response to a second challenge with LCRK (1 μm) 10 min after washout. B and C, superfusion of solvent (S, 0.1 per thousand ethanol + 0.1 per thousand DMSO), GBC (1 μm) and LCRK (1 μm). Note the spiking activity in these traces; see text for details.
