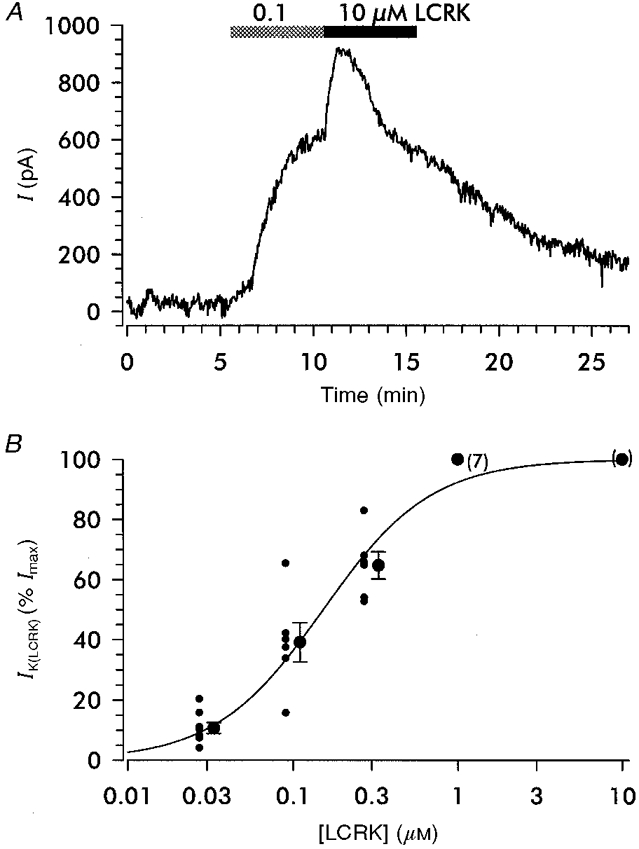
Figure 4. LCRK-induced current (IK(LCRK)) in RSC.

A, whole-cell recording at physiological K+ concentrations and a temperature of 37 °C; holding potential was −60 mV. Application of 0.1 and 10 μm LCRK induced concentration-dependent outward currents (IK(LCRK)). Note the rapid fading of the current in the continued presence of 10 μm LCRK. B, concentration dependence of IK(LCRK). Currents were normalized with respect to the maximal current (Imax) with 10 μm LCRK; Imax was 189 pA (median with 95 % confidence intervals of 161 and 368 pA; n = 20). The normalized values determined in individual experiments (small circles) and the means (larger circles) and s.e.m. are shown; for clarity, symbols are shifted to the left and right, respectively. The curve shows the Hill fit to the individual values giving a mid-point (EC50) of 152 ± 31 nm and a Hill coefficient of 1.32 ± 0.25.
