
Figure 10. Effects of a PAR-2 agonist, ATP and KCl on [Ca2+]i in myenteric neurons.
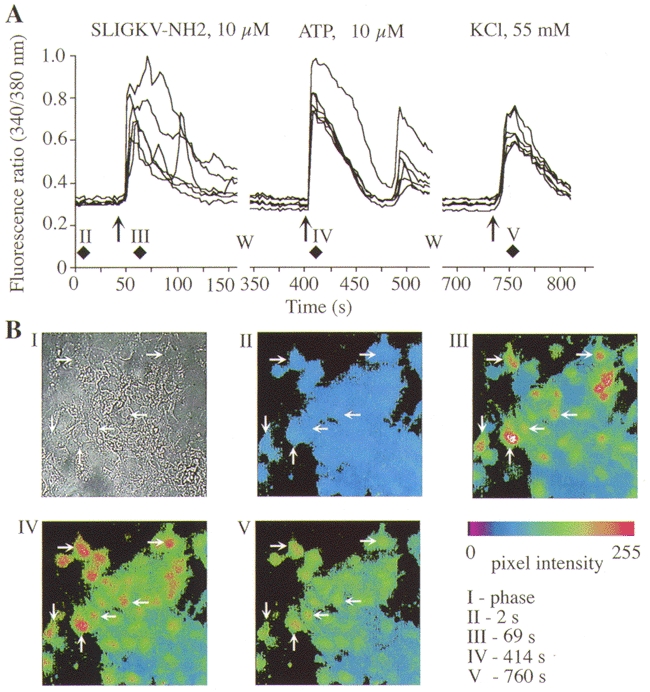
Neurons were exposed to the PAR-2 agonist, washed (W), and exposed to ATP and then KCl. A, each trace shows the 340/380 nm fluorescence ratio for a single neuron. B, I, phase contrast image of neurons. II-V, pseudo-colour images of the 340/380 fluorescence ratio for these neurons at the indicated times. Diamonds in A indicate the times at which these images were obtained.